Thị trường tiền điện tử đã chứng kiến sự biến động mạnh mẽ vào ngày 26 tháng 4 do tin đồn rằng một lượng lớn Bitcoin (BTC) đang di chuyển từ các ví được liên kết với sàn giao dịch tiền điện tử không còn tồn tại Mt. Gox và chính phủ Hoa Kỳ. Một điểm tích cực nhỏ là Bitcoin và các altcoin được chọn giữ mức hỗ trợ tương ứng của chúng
Sau đợt tăng mạnh của Bitcoin vào năm 2023, một số nhà giao dịch dường như đang có kế hoạch ghi lại lợi nhuận. Coinglass báo cáo rằng số dư Bitcoin nắm giữ tại Binance đã tăng 50.000 Bitcoin trong 30 ngày qua.
Mặc dù điều này có thể gây thêm áp lực ngắn hạn, nhưng những con bò đực có thể an ủi vì mức tăng không giống nhau giữa các sàn giao dịch. Coinglass cho biết tổng số dư Bitcoin trên các sàn giao dịch là 14.000 Bitcoin

Sự kiện lớn tiếp theo cho thị trường có thể sẽ là cuộc họp của Cục Dự trữ Liên bang Hoa Kỳ vào ngày 2 và 3 tháng 5. Công cụ FedWatch dự đoán xác suất 90% của việc tăng lãi suất 25 điểm cơ bản trong cuộc họp. Hầu hết các nhà phân tích kỳ vọng đây sẽ là lần tăng lãi suất cuối cùng trước khi xoay trục vào cuối năm nay.
Bitcoin và các altcoin chọn lọc có thể vượt qua mức kháng cự tương ứng của chúng và tiếp tục xu hướng tăng? Hãy cùng nghiên cứu biểu đồ của 10 loại tiền điện tử hàng đầu để tìm hiểu
Phân tích giá Bitcoin
Bitcoin đã hình thành mô hình nến doji chân dài vào ngày 26 tháng 4, cho thấy sự thiếu quyết đoán giữa những người đầu cơ giá lên và phe gấu về động thái định hướng tiếp theo. Sự không chắc chắn này đã giải quyết theo hướng tăng với mức đóng cửa trên đường trung bình động theo cấp số nhân 20 ngày ($28.619) vào

Những con gấu sẽ cố gắng kéo giá trở lại dưới đường EMA 20 ngày trong khi phe bò sẽ cố gắng lật mức này thành hỗ trợ. Nếu người mua thành công, cặp BTC/USDT sẽ cố gắng thách thức vùng kháng cự trên từ $31,000 đến $32,400. Khu vực này có khả năng chứng kiến một cuộc chiến khó khăn giữa phe bò và gấu.
Trái ngược với giả định này, nếu giá giảm và trượt xuống dưới đường EMA 20 ngày, nó sẽ chỉ ra rằng tâm lý đang chuyển sang tiêu cực và các nhà giao dịch đang bán khi tăng. Cặp tiền này sau đó có thể kiểm tra lại mức hỗ trợ mạnh tại đường trung bình động đơn giản 50 ngày ($27,657). Việc phá vỡ và đóng cửa dưới mức này có thể mở ra cánh cửa giảm xuống còn 25,250 đô la
Phân tích giá ETH
Phe bò đã đá Ether (ETH) trên đường EMA 20 ngày ($1,905) vào ngày 26 và 27 tháng 4 nhưng chúng không thể đạt đến mức tâm lý 2.000 đô la. Điều này cho thấy phe gấu đang cố gắng ngăn chặn sự phục hồi dưới 2.000 đô la

Đường EMA 20 ngày đã đi ngang và chỉ số RSI ở gần điểm giữa, cho thấy sự cân bằng giữa cung và cầu. Điều này cho thấy một hành động giới hạn phạm vi có thể xảy ra giữa 2.000 đô la và 1.785
Nếu điều đó xảy ra, đó sẽ là một dấu hiệu tích cực vì nó sẽ chỉ ra rằng những con bò đực không vội vã ghi lại lợi nhuận. Điều đó sẽ nâng cao triển vọng cho một đợt tăng giá tiềm năng lên 2.200 đô la. Quan điểm tích cực này sẽ vô hiệu nếu giá giảm và phá vỡ dưới $1,785. Cặp ETH/USDT sau đó có thể sụp đổ xuống mức thoái lui Fibonacci 61,8%
Phân tích giá BNB
Các nhà đầu cơ giá đã đẩy BNB (BNB) lên trên ngưỡng kháng cự $338 vào ngày 26 tháng 4 nhưng họ không thể duy trì các mức cao hơn như đã thấy từ bấc dài trên nến trong ngày.

Phe bò một lần nữa cố gắng vượt qua chướng ngại vật ở mức $338 vào ngày 27 tháng 4 nhưng phe gấu đã không nhúc nhích. Việc bán đã lấy đà vào ngày 28 tháng 4 và phe gấu đang cố gắng giảm giá xuống dưới đường SMA 50 ngày ($321). Nếu họ thành công, cặp BNB/USDT có thể giảm xuống 300 đô la và sau đó xuống còn 280 đô la
Thay vào đó, nếu giá phục hồi khỏi mức hiện tại, nó sẽ chỉ ra rằng những con bò đực đã không từ bỏ và đang mua khi giảm. Phe bò sẽ phải vượt qua rào cản ở mức 350 đô la để báo hiệu sự bắt đầu của một xu hướng tăng mới hướng tới 400 đô la
Phân tích giá XRP
XRP (XRP) bounced off the support at $0.43 on April 26, indicating that the bulls are fiercely guarding this level.
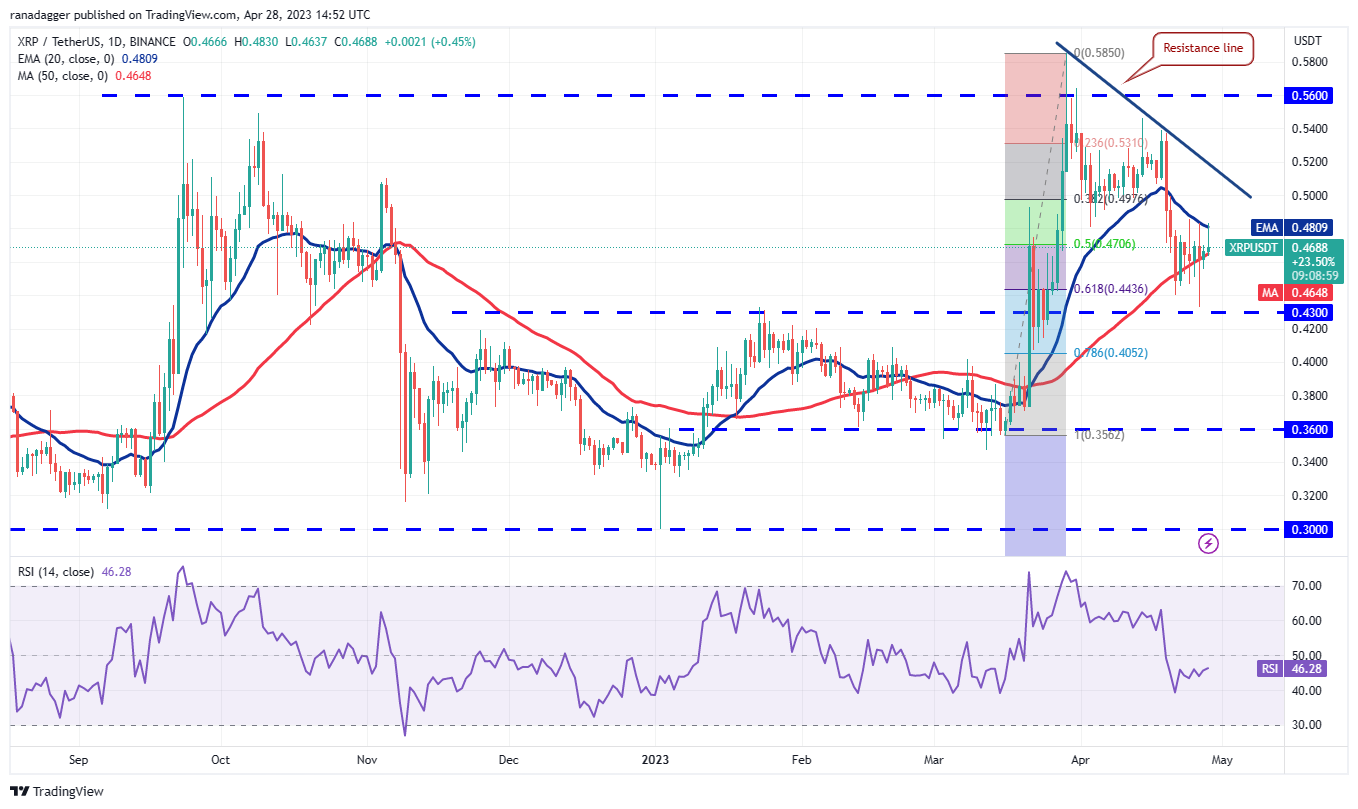
The price has reached the 20-day EMA ($0.48), which is an important level for the bears to defend in the near term. If the price turns down from this level, the sellers will again try to yank the price below $0.43. If they manage to do that, the XRP/USDT pair may plunge to $0.36.
Contrarily, if buyers kick the price above the 20-day EMA, the pair can reach the resistance line. A break and close above this level will suggest that the short-term corrective phase is over. The pair will then attempt a rally to $0.54 and subsequently to $0.58.
Cardano price analysis
Cardano (ADA) rebounded off the 50-day SMA ($0.38) on April 25 and 26, indicating that buyers are trying to start a recovery from this support.
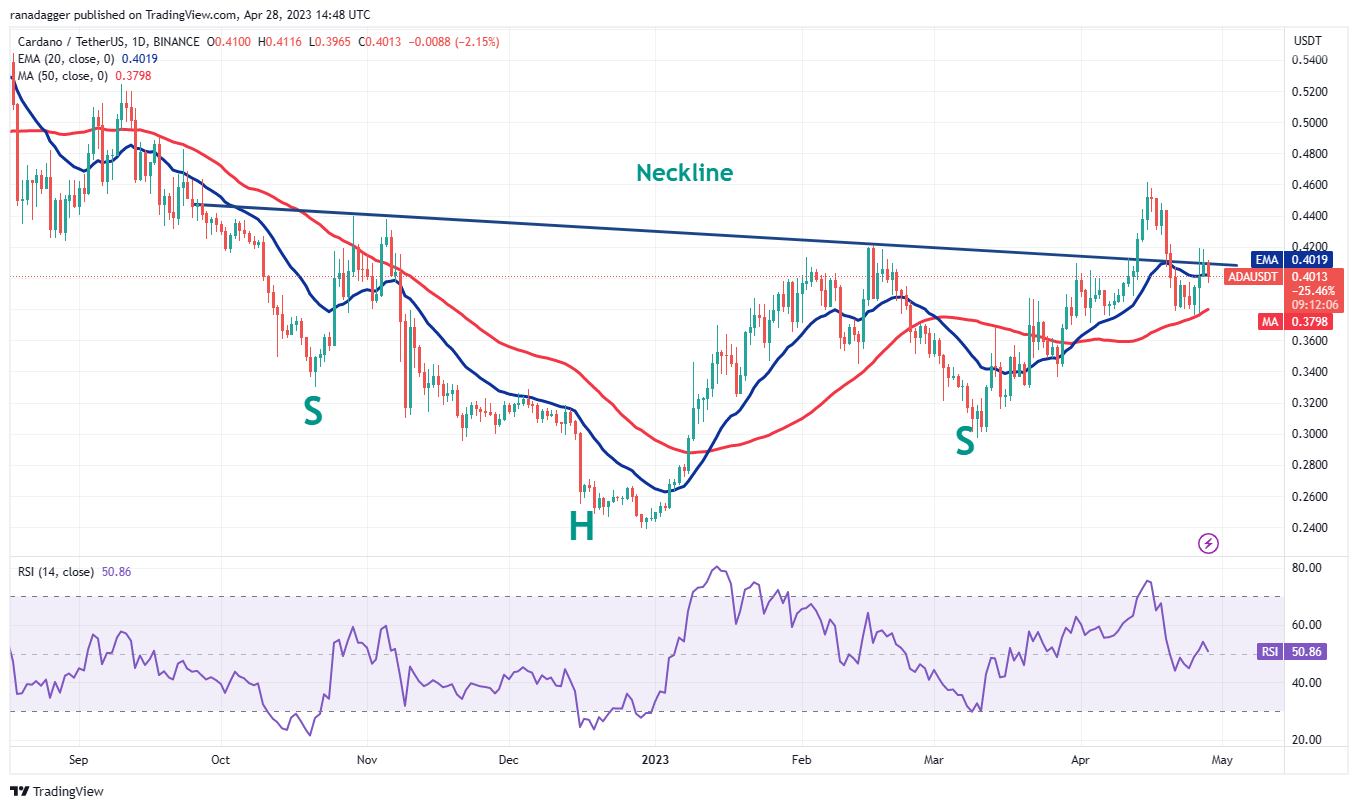
The ADA/USDT pair has reached the neckline of the inverse head and shoulders pattern where the bears are trying to halt the recovery. If buyers overpower the sellers and sustain the price above the neckline, the pair should rally to $0.46.
Conversely, if the price turns down from the neckline, it will suggest that the bears are trying to prevent the reversal pattern from forming. The sellers will then make another attempt to sink the price below the 50-day SMA. If they can pull it off, the pair could dump to $0.34.
Dogecoin price analysis
The bears pulled Dogecoin (DOGE) below the support near $0.08 on April 26 but they failed to build upon the breakdown. Buyers purchased the dip and pushed the price back above the 50-day SMA ($0.08) on April 27.
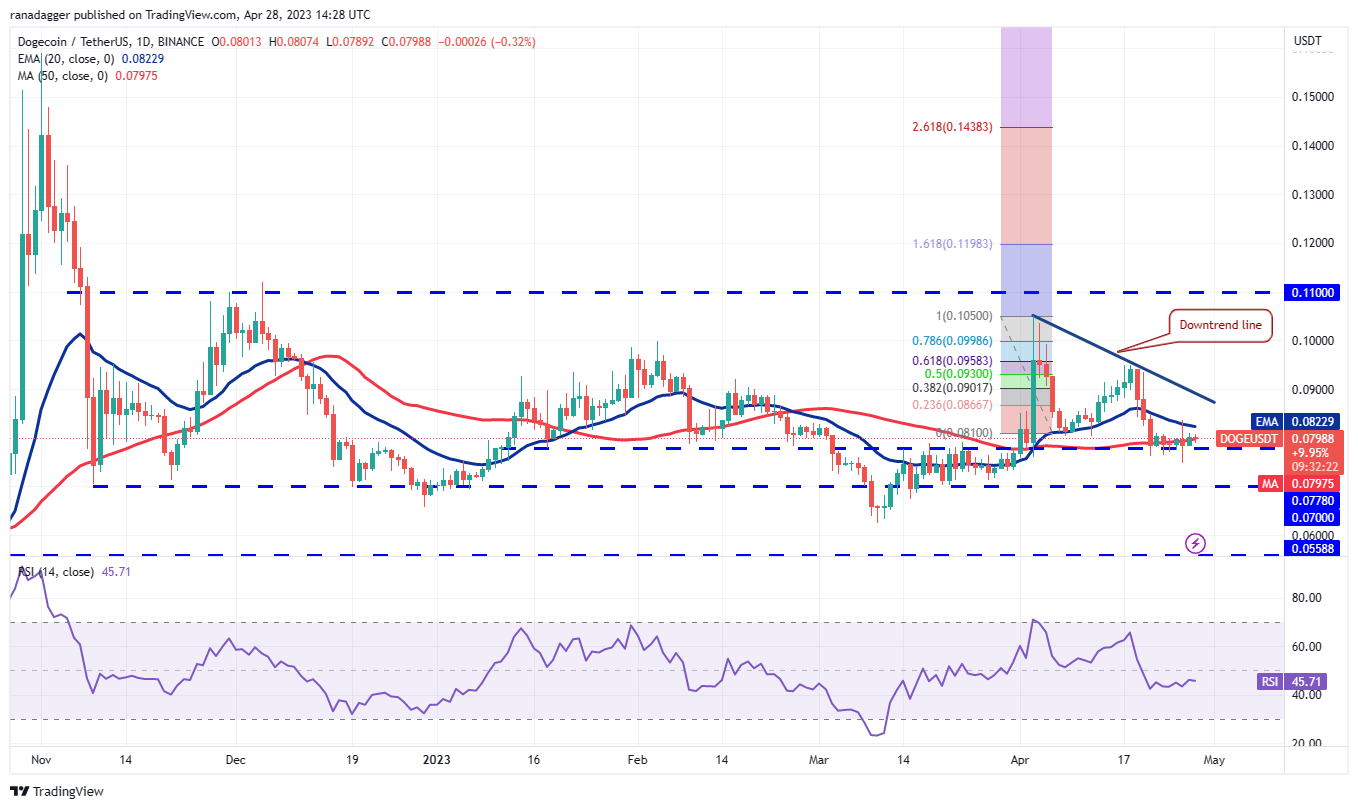
The next resistance to watch out for is the 20-day EMA ($0.08) and then the downtrend line. Buyers will have to propel the price above the downtrend line to clear the path for a possible rally to the $0.10 to $0.11 resistance zone.
Meanwhile, the bears are likely to have other plans. They will try to sink the price back below the support near $0.08. If they succeed, the DOGE/USDT pair may slide to the vital support near $0.07. The bulls are likely to protect this level with all their might.
Polygon price analysis
The long tail on Polygon’s (MATIC) April 25 and 26 candlestick shows that the bulls are defending the support at $0.94 with vigor but the bears have not yet given up.

The downsloping 20-day EMA ($1.05) and the RSI in the negative territory indicate that bears have the upper hand. Sellers will try to halt the recovery in the zone between the 20-day EMA and the resistance line.
If the price turns down from the resistance line, it will signal the formation of a potential descending triangle pattern, which will complete on a break below $0.94. If this support cracks, the MATIC/USDT pair risks a plunge to $0.69.
Related: Bitcoin price holds $29K as US PCE data sparks 90% Fed rate hike bets
Solana price analysis
Solana (SOL) tried to break out of the tight range trading on April 26 but failed. The bulls are again trying to resolve the uncertainty in their favor on April 28.
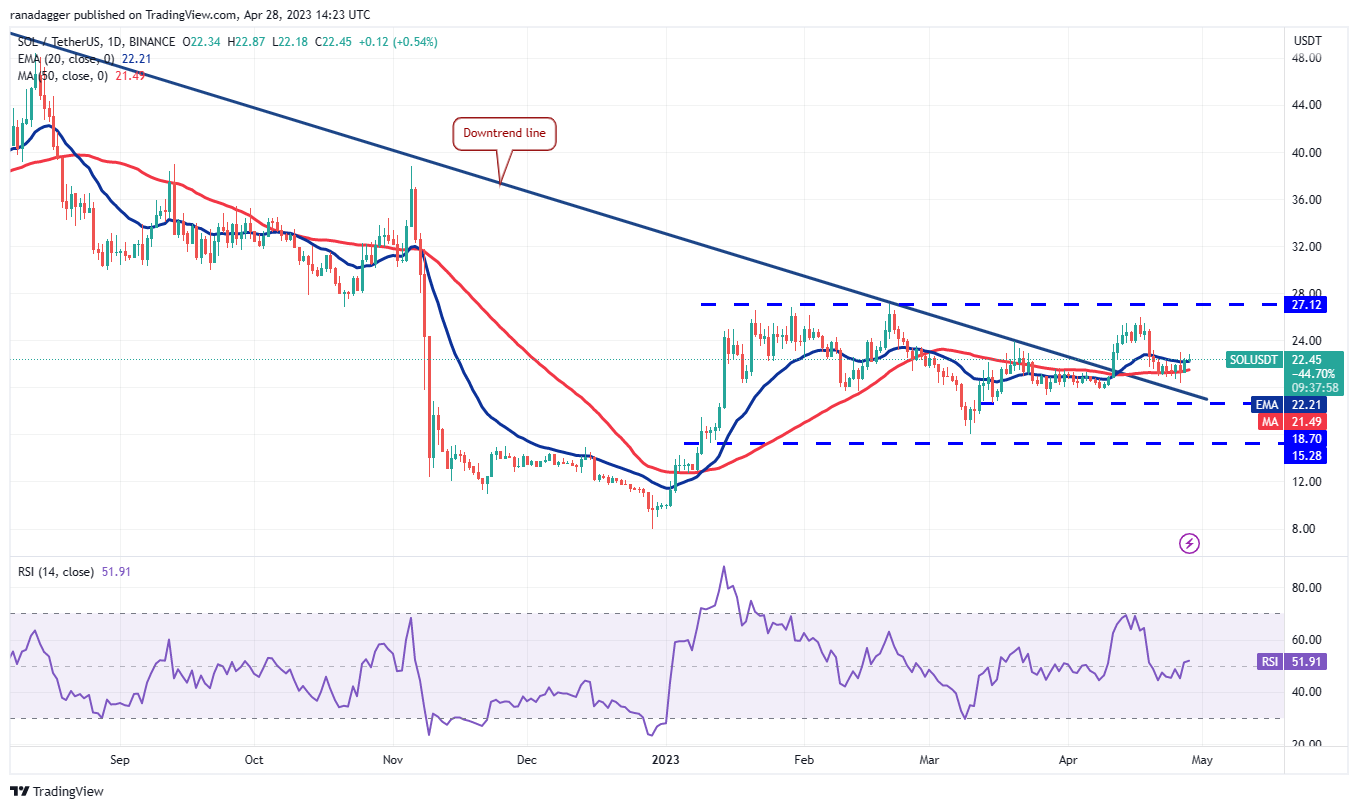
If the price rises above the immediate resistance at $23.18, it will signal that the bulls have absorbed the supply. The SOL/USDT pair will then attempt a rally toward the stiff overhead resistance at $27.12, which remains the key level for the bulls to overcome. If they do that, the pair can start a new up-move and soar to $39.
If bears want to prevent the rally, they will have to quickly tug the price below the $18.70 support. That can sink the pair to the next support at $15.28.
Polkadot price analysis
The bears successfully defended the moving averages on April 26 but could not sustain the drop below the support at $5.70. This indicates that Polkadot (DOT) is finding buyers at lower levels.
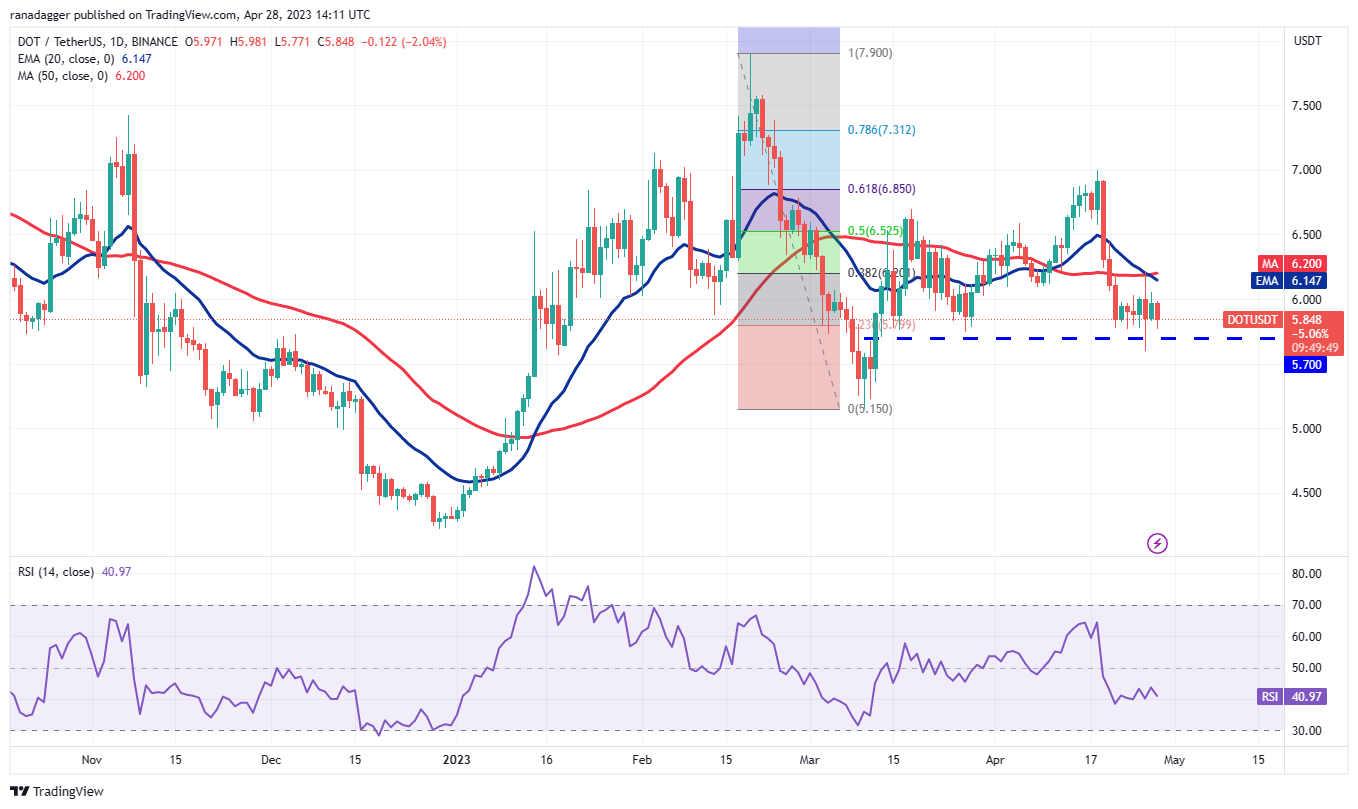
The DOT/USDT pair can swing between $5.70 and the 50-day SMA ($6.20) for some time. If the consolidation resolves to the downside, the selling could intensify and the pair may fall to $5.15. This level is likely to attract buyers.
Alternatively, if buyers drive the price above the 50-day SMA, it will suggest that the bulls are on a comeback. The pair may first climb to $7 and if this resistance is scaled, the rally could stretch to $7.90.
Litecoin price analysis
Litecoin (LTC) witnessed a hugely volatile day on April 26, indicating that the bulls and the bears tried to gain complete control but failed.
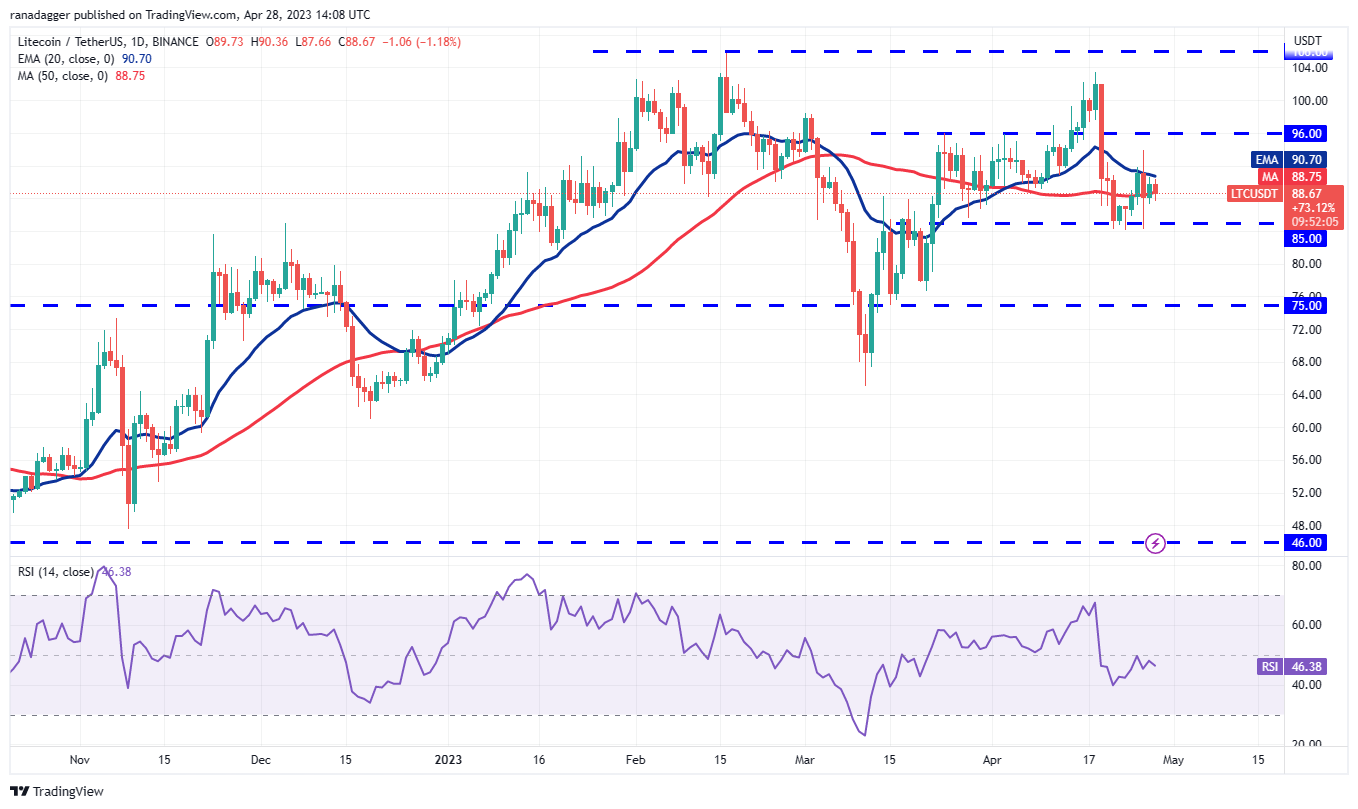
Usually, large volatile days are followed by a range contraction for a few days. The flattish moving averages and the RSI just below the midpoint suggest a range-bound action in the near term. The LTC/USDT pair may oscillate between $85 and $96 for some time.
A break above $96 or below $85 will start the next leg of the trending move. If bears sink the price below $85, the pair may plummet to $75. On the other hand, a rally above $96 may open the gates for a possible rally to $106.
This article does not contain investment advice or recommendations. Every investment and trading move involves risk, and readers should conduct their own research when making a decision.


