Chỉ số S&P 500 (SPX) đã tăng trong năm tuần liên tiếp, lần đầu tiên như vậy kể từ tháng 11 năm 2021. Trong khi đó, Bitcoin (BTC) đang giao dịch dưới mức cao nhất địa phương là 31,000 đô la, được thực hiện vào ngày 14 tháng 4. Điều này cho thấy sự khác biệt rõ ràng giữa hiệu suất của hai loại tài sản
Một số nhà phân tích kỳ vọng hành động giới hạn phạm vi của Bitcoin sẽ tiếp tục trong một thời gian nữa. Các nhà giao dịch tiền điện tử sẽ tìm kiếm một số yếu tố kích hoạt tích cực có thể đẩy giá lên trên phạm vi. Một tin đồn như vậy trôi nổi trên thị trường là sau khi BlackRock nộp đơn xin một quỹ giao dịch trao đổi giao ngay Bitcoin, Fidelity Investments cũng có thể làm theo. Nếu điều đó xảy ra, nó sẽ là một dấu hiệu tích cực cho thị trường.
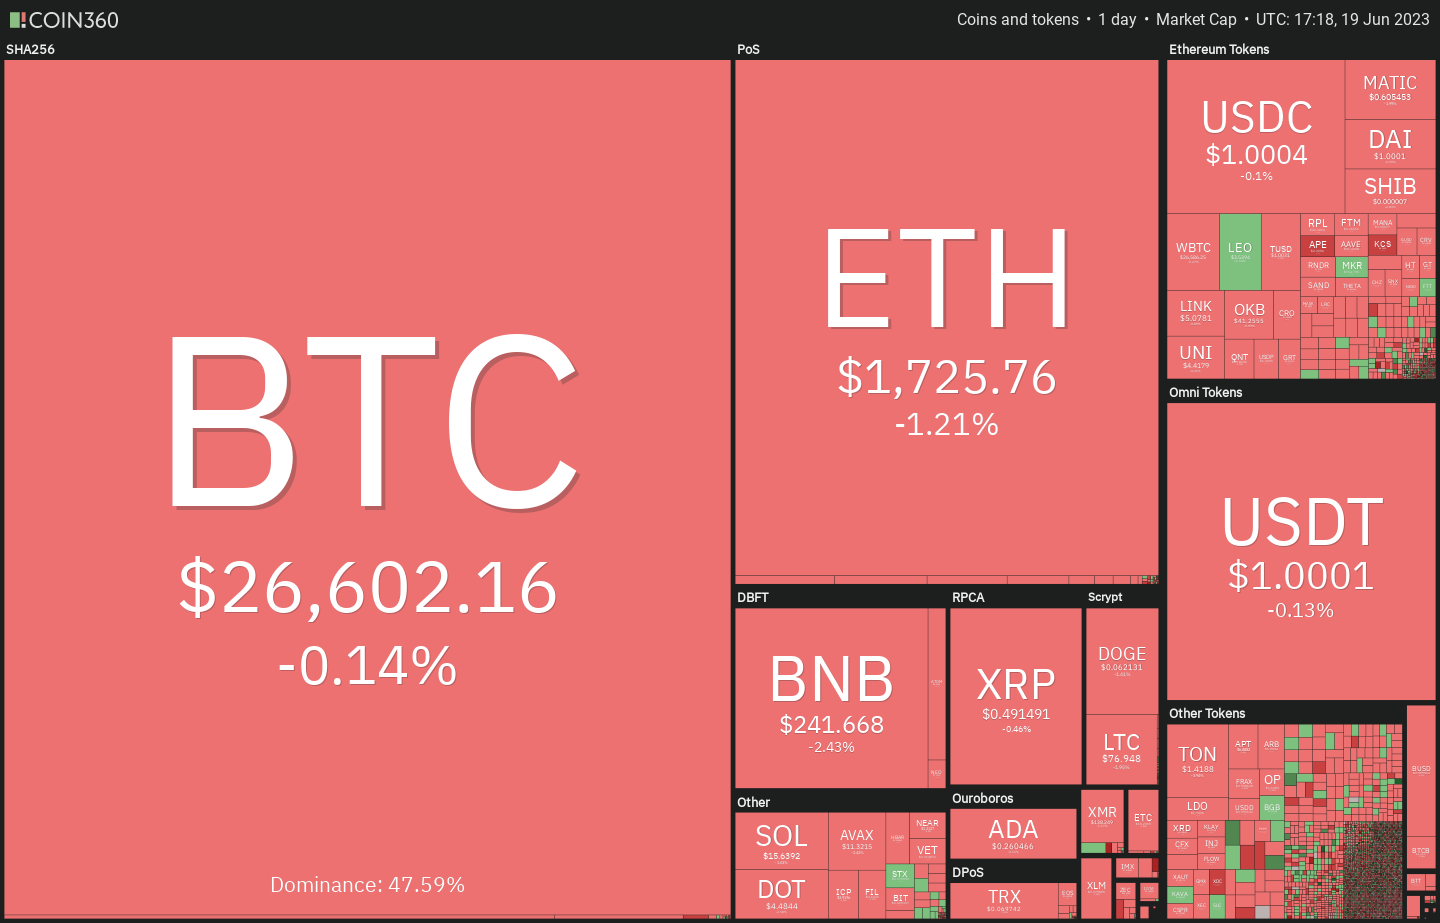
Một điều tích cực khác đối với thị trường tiền điện tử là Chỉ số Đô la Mỹ (DXY) đã giảm trong tuần qua. Trong lịch sử, đồng đô la và Bitcoin có mối tương quan nghịch đảo, điều này có thể giúp hạn chế sự sụt giảm của Bitcoin và khởi động một cuộc biểu tình cứu trợ
Chúng ta hãy xem xét các mức kháng cự quan trọng cần phải vượt qua để bắt đầu sự phục hồi bền vững của Bitcoin và các altcoin chính.
Phân tích giá chỉ số S&P 500
S&P 500 đang trong xu hướng tăng ngắn hạn. Sự phục hồi trong vài ngày qua đã đẩy chỉ số sức mạnh tương đối (RSI) vào vùng quá mua, cho thấy rằng một sự điều chỉnh hoặc củng cố nhỏ
là có thể.
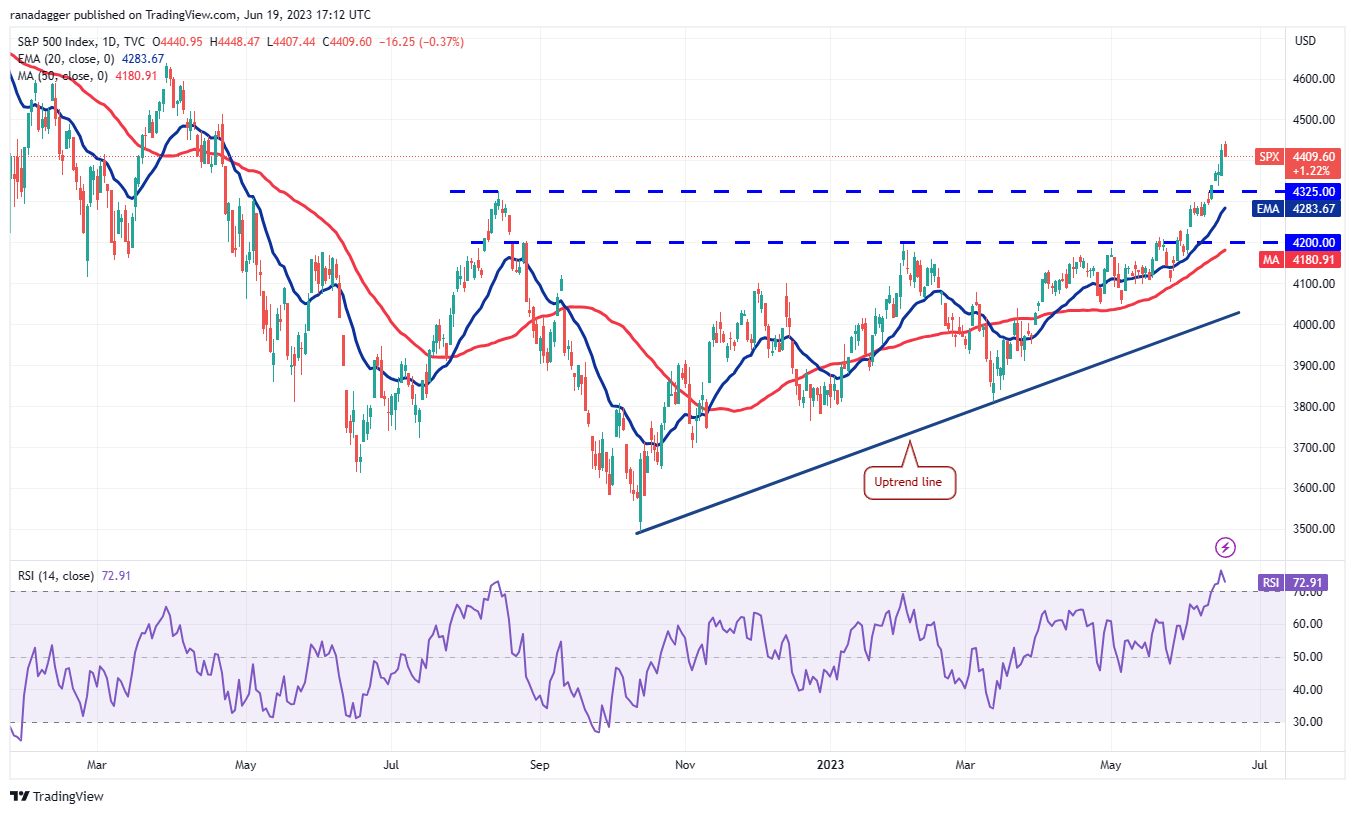
The index could turn down and retest the breakout level of 4,325. If the price rebounds off this level, it will suggest that buyers have flipped 4,325 into support. That will enhance the prospects of a rally to 4,500 and thereafter to 4,650.
Trái ngược với giả định này, nếu giá giảm xuống và phá vỡ dưới đường trung bình động hàm mũ (EMA) 20 ngày là 4,283, nó sẽ cho thấy đà tăng đang suy yếu. Điều đó có thể kéo chỉ số xuống đường trung bình động đơn giản 50 ngày (SMA) là 4,180. Dưới mức này, lợi thế có thể nghiêng về phía gấu.
Phân tích giá Chỉ số Đô la Mỹ
Sự thất bại của phe bò trong việc duy trì Chỉ số Đô la Mỹ trở lại trên đường EMA 20 ngày (103) vào ngày 12 tháng 6 đã đẩy nhanh quá trình bán ra. Điều đó đã kéo chỉ số trở lại dưới SMA 50 ngày (102) vào ngày 15 tháng 6
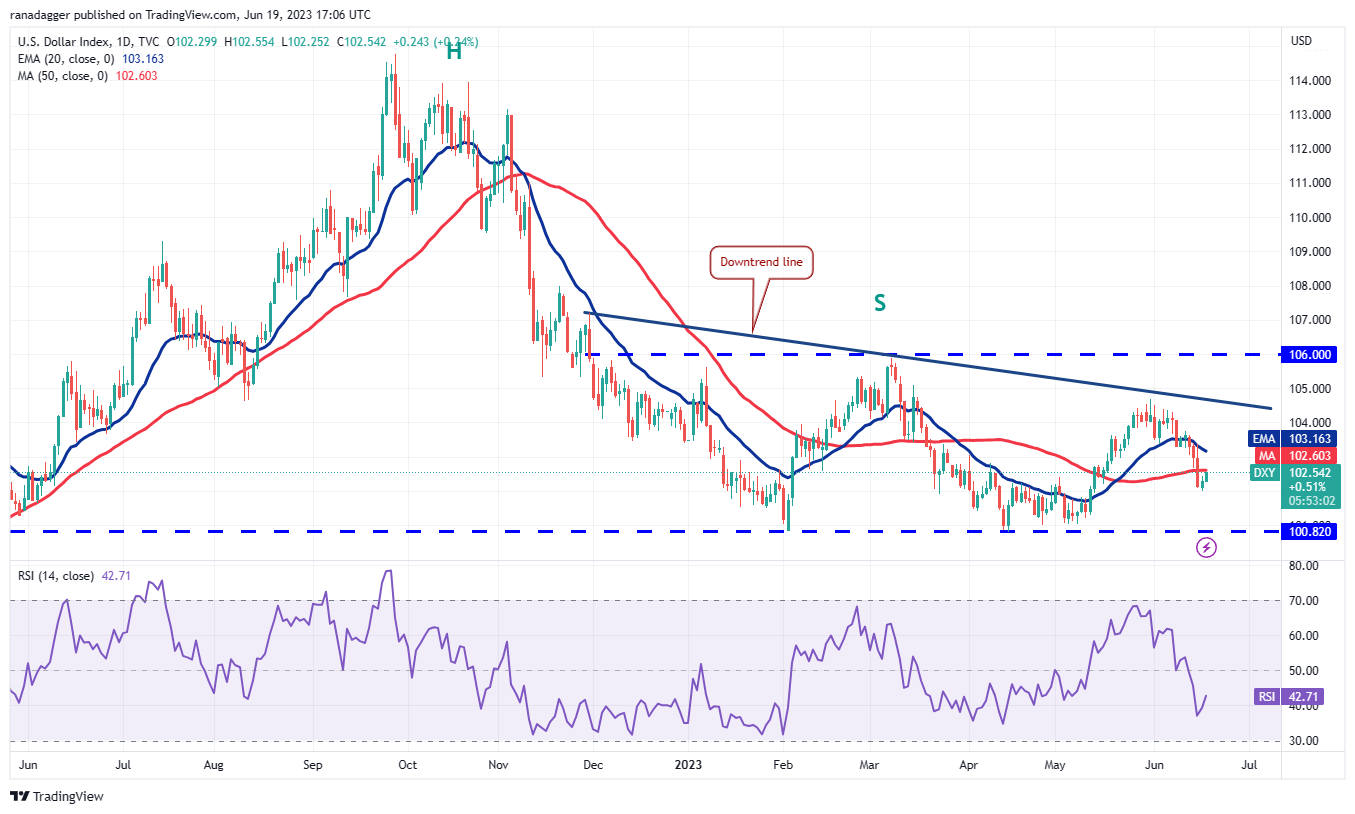
Đường EMA 20 ngày đã bắt đầu đi xuống và chỉ báo RSI nằm trong vùng tiêu cực, cho thấy phe gấu chiếm thế thượng phong. Người bán sẽ cố gắng giảm giá xuống mức hỗ trợ quan trọng tại 100.82. Việc phá vỡ và đóng cửa dưới mức này sẽ báo hiệu sự tiếp tục của xu hướng giảm
Ngược lại, nếu người mua nhanh chóng đẩy giá trở lại trên đường trung bình động, nó sẽ gợi ý rằng chỉ số có thể tăng lên đường xu hướng giảm. Người mua sẽ phải đẩy giá lên trên mức này để mở cửa cho một đợt tăng có thể lên 106.
Phân tích giá Bitcoin
Bitcoin đã được điều chỉnh bên trong mô hình kênh giảm dần trong vài tuần qua.
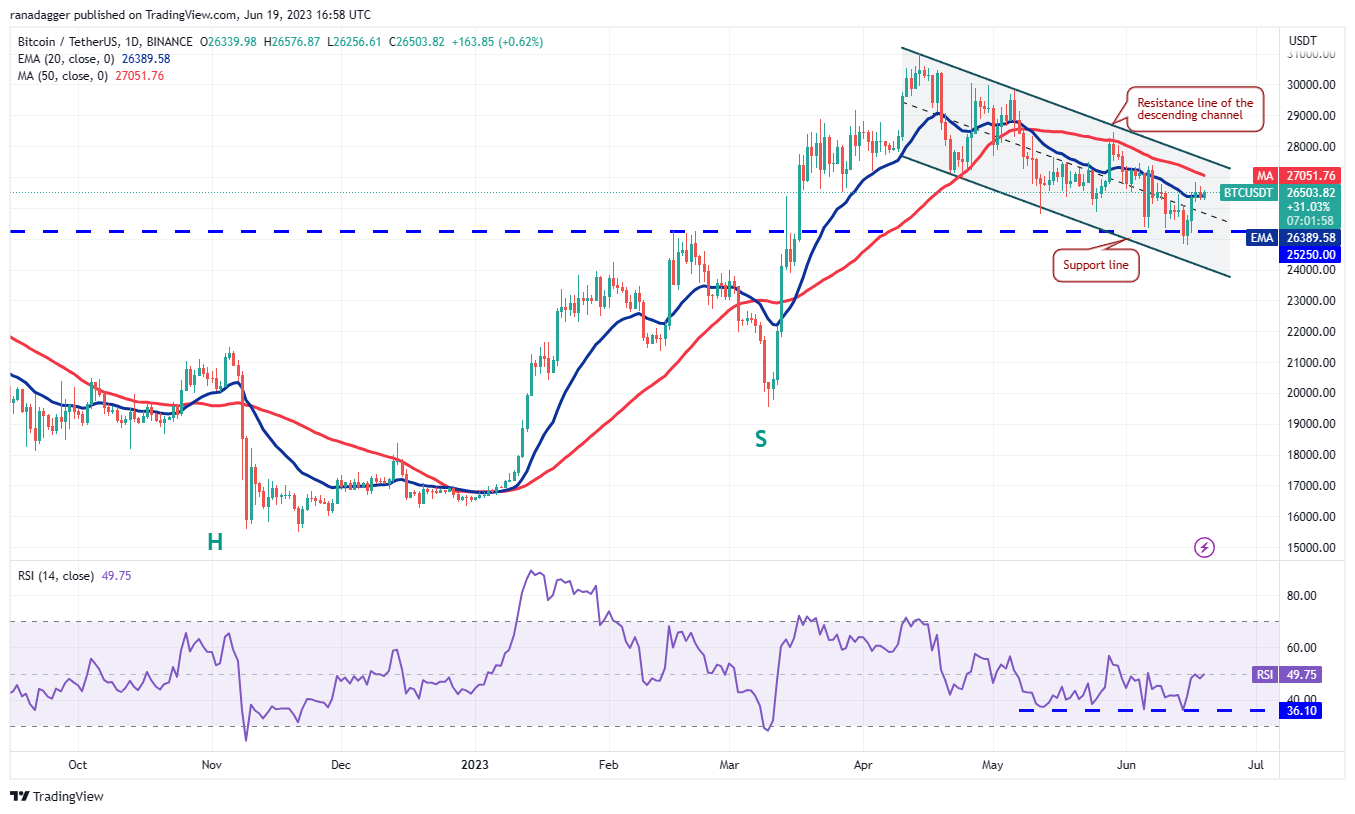
Đường EMA 20 ngày ($26,389) đang đi ngang và chỉ báo RSI đã leo lên điểm giữa, cho thấy áp lực bán có thể giảm. Người mua sẽ cố gắng đẩy giá đến đường kháng cự của kênh. Đây là một mức quan trọng để phe gấu bảo vệ vì việc phá vỡ và đóng cửa trên nó có thể bắt đầu một động thái tăng mới.
Ngoài ra, nếu giá giảm mạnh so với mức hiện tại, nó sẽ gợi ý rằng những con gấu tiếp tục bán trên các đợt phục hồi. Cặp BTC/USDT sau đó có thể kiểm tra lại vùng hỗ trợ mạnh giữa $25,250 và $
Phân tích giá Ether
Nỗ lực của Ether (ETH) để bắt đầu phục hồi đang phải đối mặt với việc bán tại đường EMA 20 ngày (1.766 đô la), nhưng một điểm tích cực nhỏ là phe bò đã không cho phép giá trượt trở lại dưới $1,700.
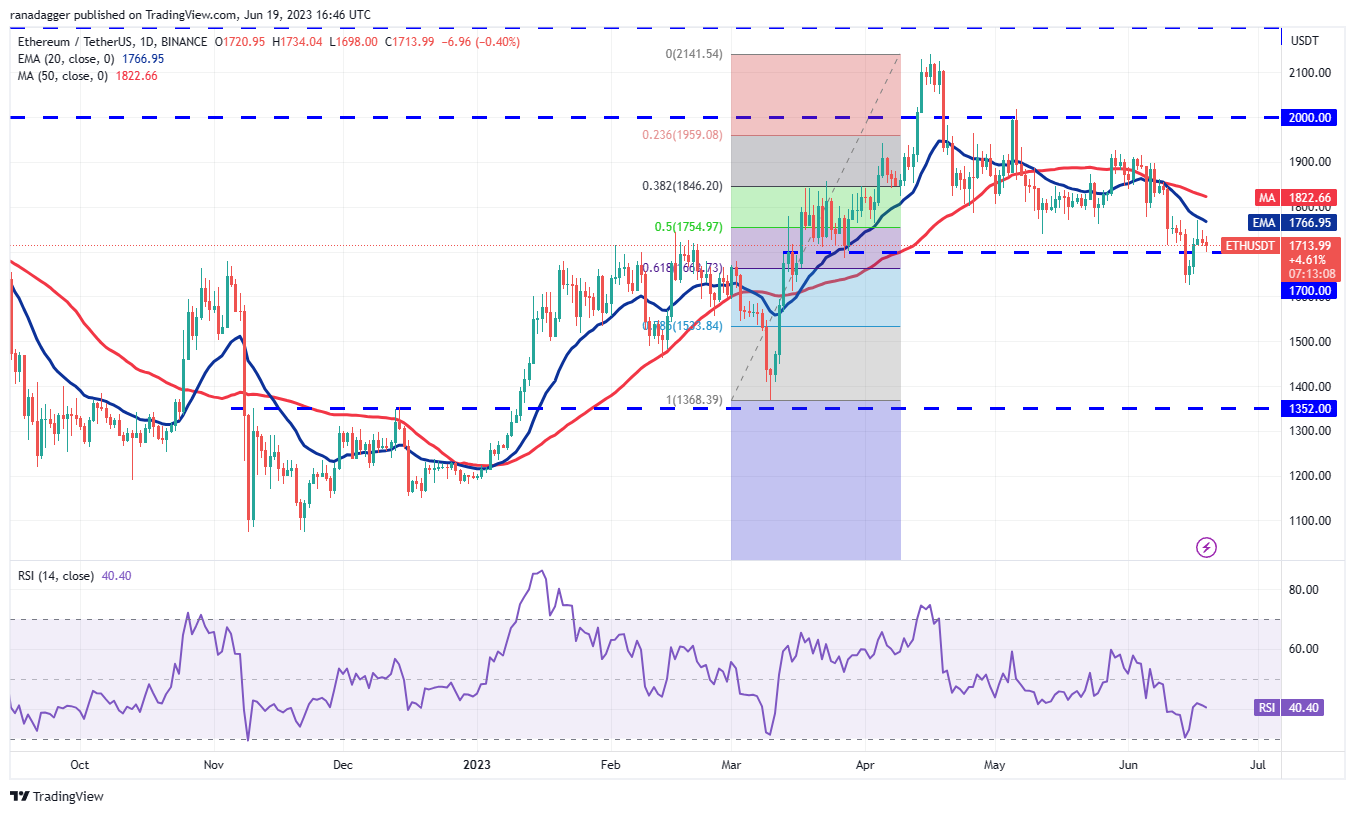
If the price turns up from $1,700, the ETH/USDT pair will again attempt to rally above the 20-day EMA. If that happens, it will suggest that the short-term corrective phase may be over. The pair may first rise to $1,928 and subsequently to $2,000.
Contrarily, if the price turns down from the current level and breaks below $1,700, it will indicate that bears remain in command. There is minor support at $1,600, but if this level gets taken out, the pair may plunge to $1,352.
BNB price analysis
BNB’s (BNB) relief rally is facing selling at the 38.2% Fibonacci retracement level of $252.50, but a positive sign is that the bulls have not given up much ground.
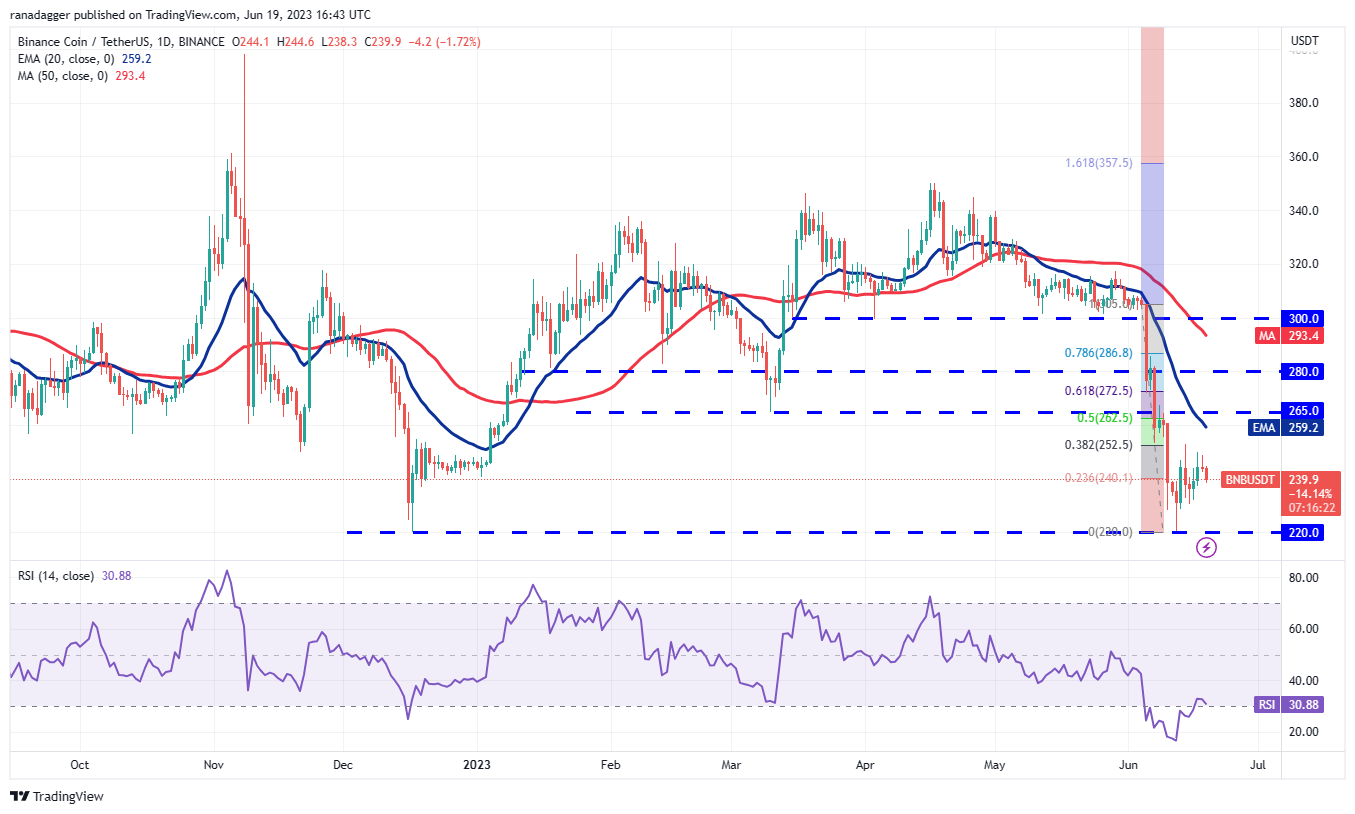
The bulls will again try to thrust the price above the overhead resistance zone between $252.50 and the 20-day EMA ($259). If they can pull it off, the BNB/USDT pair may climb to the 61.8% retracement level of $272.50. The bears are expected to fiercely protect this level.
Contrary to this assumption, if the price turns down from the current level or the overhead resistance, it will suggest that the bears are not ready to give up their hold. The pair could then once again drop to the critical support at $220.
XRP price analysis
The bears repeatedly pulled XRP (XRP) below the 50-day SMA ($0.47) between June 14 and 17, but they could not sustain the lower levels. This suggests buying on dips.
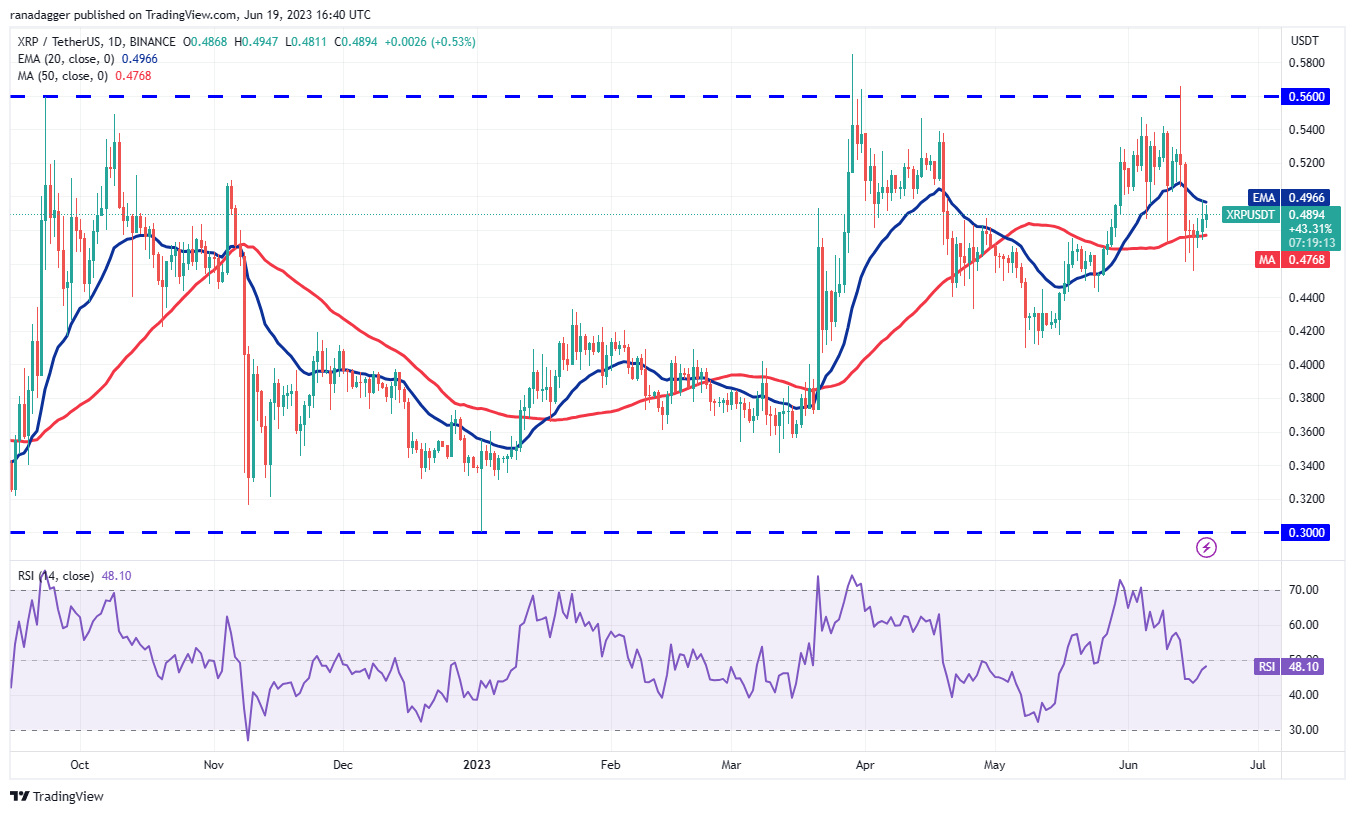
The bulls are trying to push the price above the 20-day EMA ($0.49). If they achieve that, it will indicate that the XRP/USDT pair may swing between the 50-day SMA and $0.56 for some more time. The flattening 20-day EMA and the RSI near 50 also point to a possible consolidation in the short term.
If bears want to remain on top, they will have to quickly tug the price below $0.45. That could accelerate selling and sink the pair to $0.41.
Cardano price analysis
The bulls are struggling to start a relief rally in Cardano (ADA) even though the RSI is at deeply oversold levels.
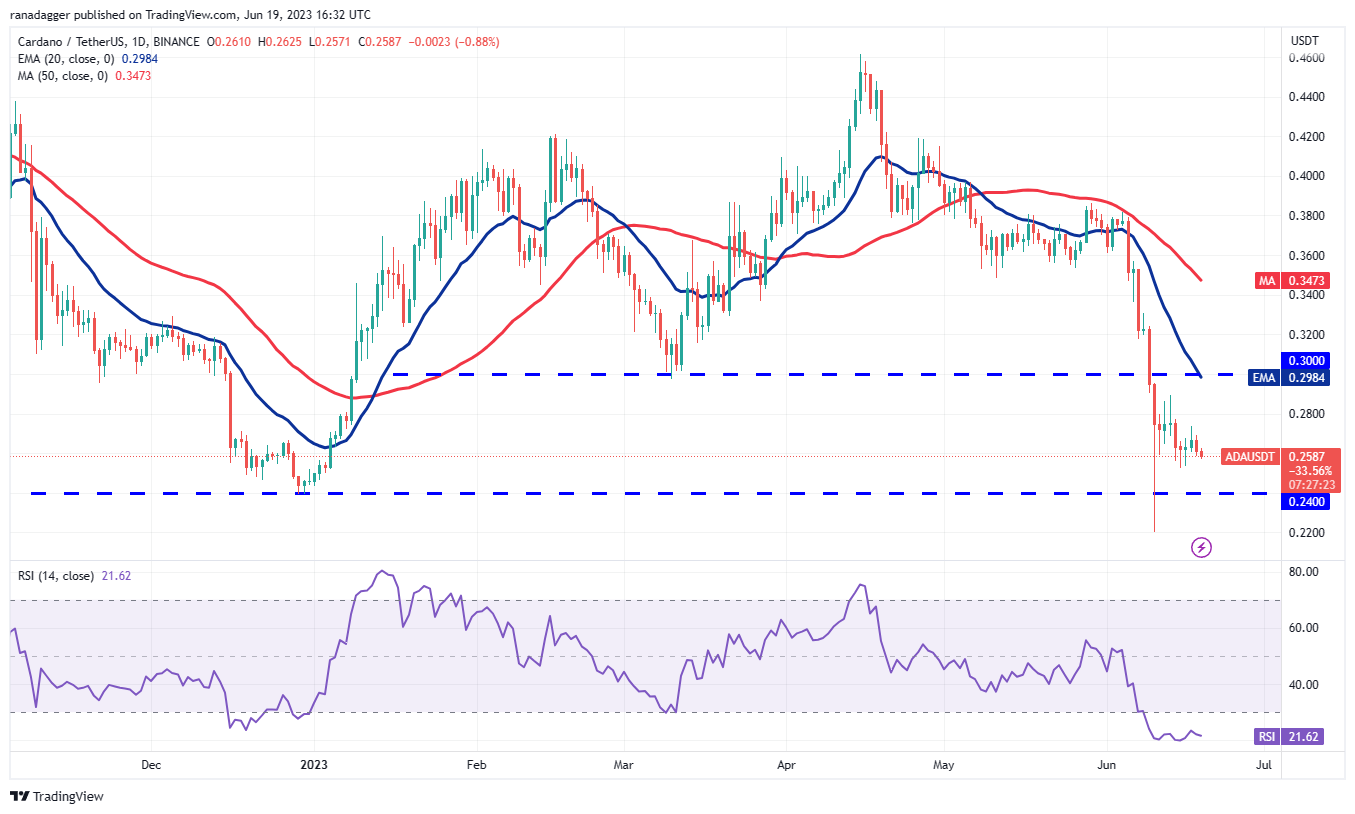
The bears are trying to sink the price to the vital support at $0.24. This is important support to keep an eye on because if it cracks, the ADA/USDT pair may skid to $0.22 and then extend the decline to $0.20.
Buyers are likely to have other plans. They will try to guard the zone between $0.24 and $0.22 with vigor. If the price turns up from this zone, it will suggest that the pair may consolidate between $0.24 and $0.30 for a while. The first sign of strength will be a break and close above the 20-day EMA ($0.30).
Related: Why is Cardano price down today?
Dogecoin price analysis
Dogecoin (DOGE) has been trading inside a tight range between the 20-day EMA ($0.06) and the horizontal support at $0.06 for the past few days.
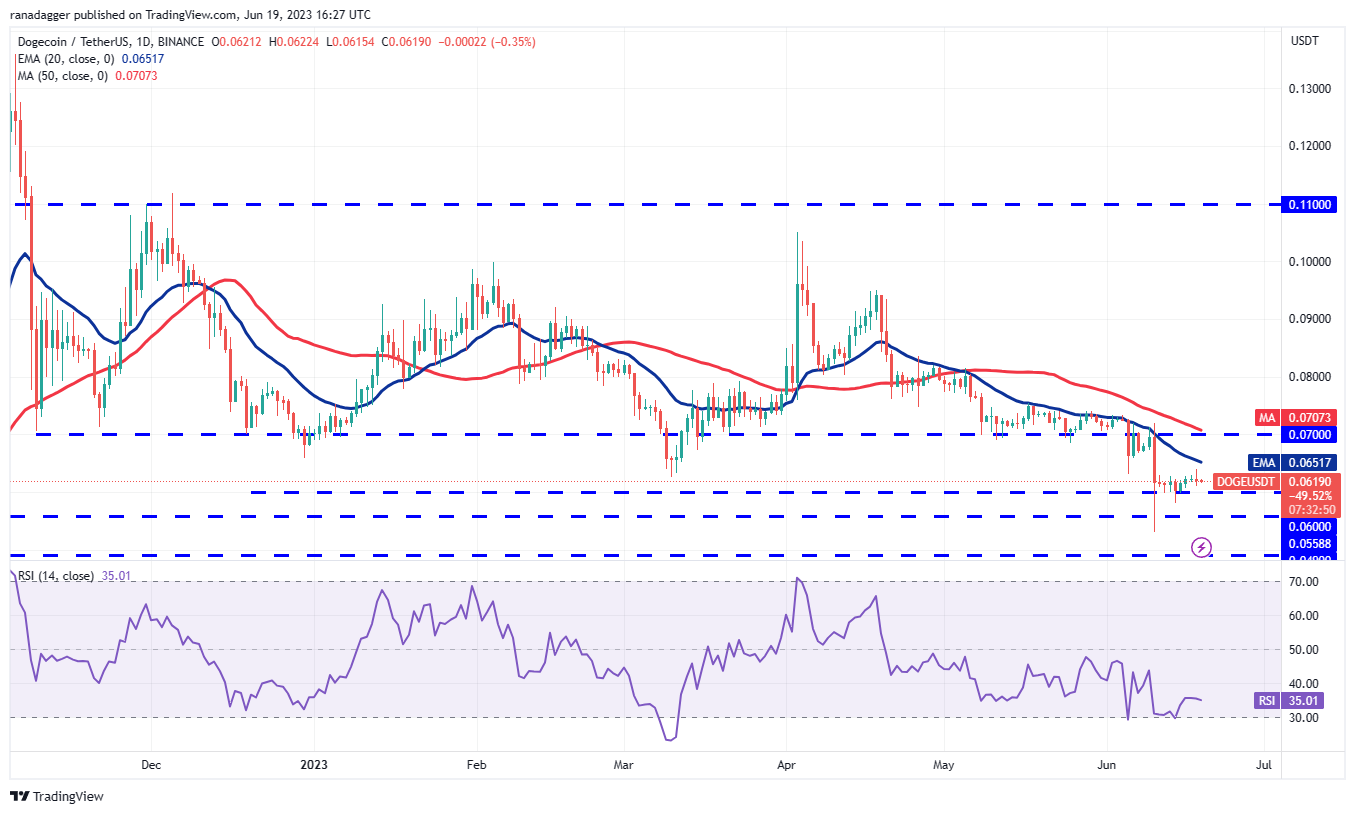
The failure of the DOGE/USDT pair to rise above the 20-day EMA suggests that the sentiment remains negative and the bears are selling on every minor rally. That increases the risk of a break below the vital support at $0.06. If this level gives way, the pair may collapse to $0.05.
On the upside, the 20-day EMA remains the key hurdle for the bulls to cross. If they sustain the price above this resistance, the pair could rally to $0.08. This level may pose a strong challenge to the bulls.
Solana price analysis
Solana (SOL) is witnessing a tough battle near the $15.28 level. Buyers pushed the price above this level, but they have not been able to overcome the barrier at $16.18.
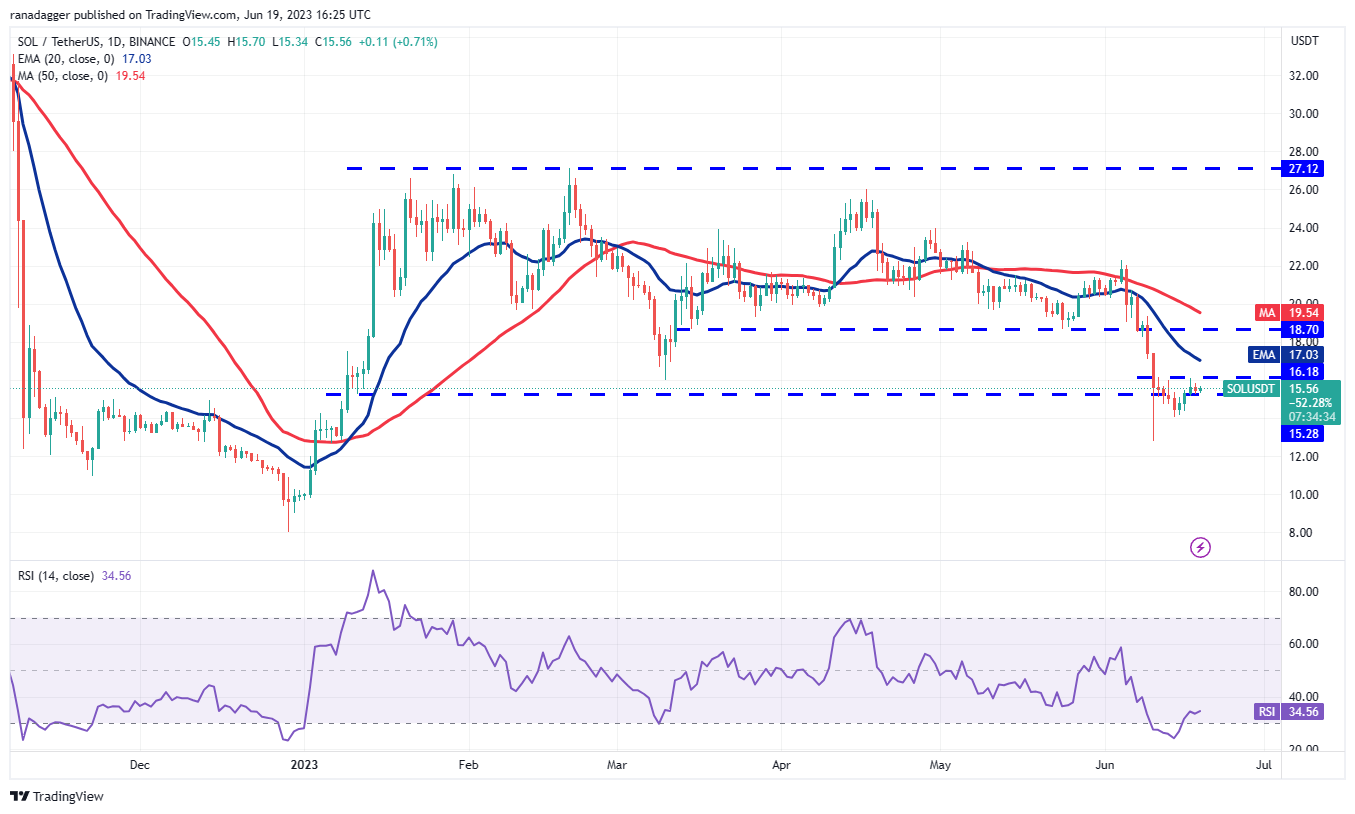
The bears are trying to sink the price below $15.28. If they do that, the SOL/USDT pair could slide to $14.06 and later to the support at $12.80. This is an important level to watch out for because if it breaks down, the pair may tumble to $10.
The first sign of strength will be a break above the zone between $16.18 and the 20-day EMA ($17.03). That could clear the path for a potential retest of the breakdown level of $18.70. This level is likely to attract strong selling by the bears.
Litecoin price analysis
The bulls are trying to keep Litecoin (LTC) above the immediate support at $75, which suggests that lower levels are being bought.
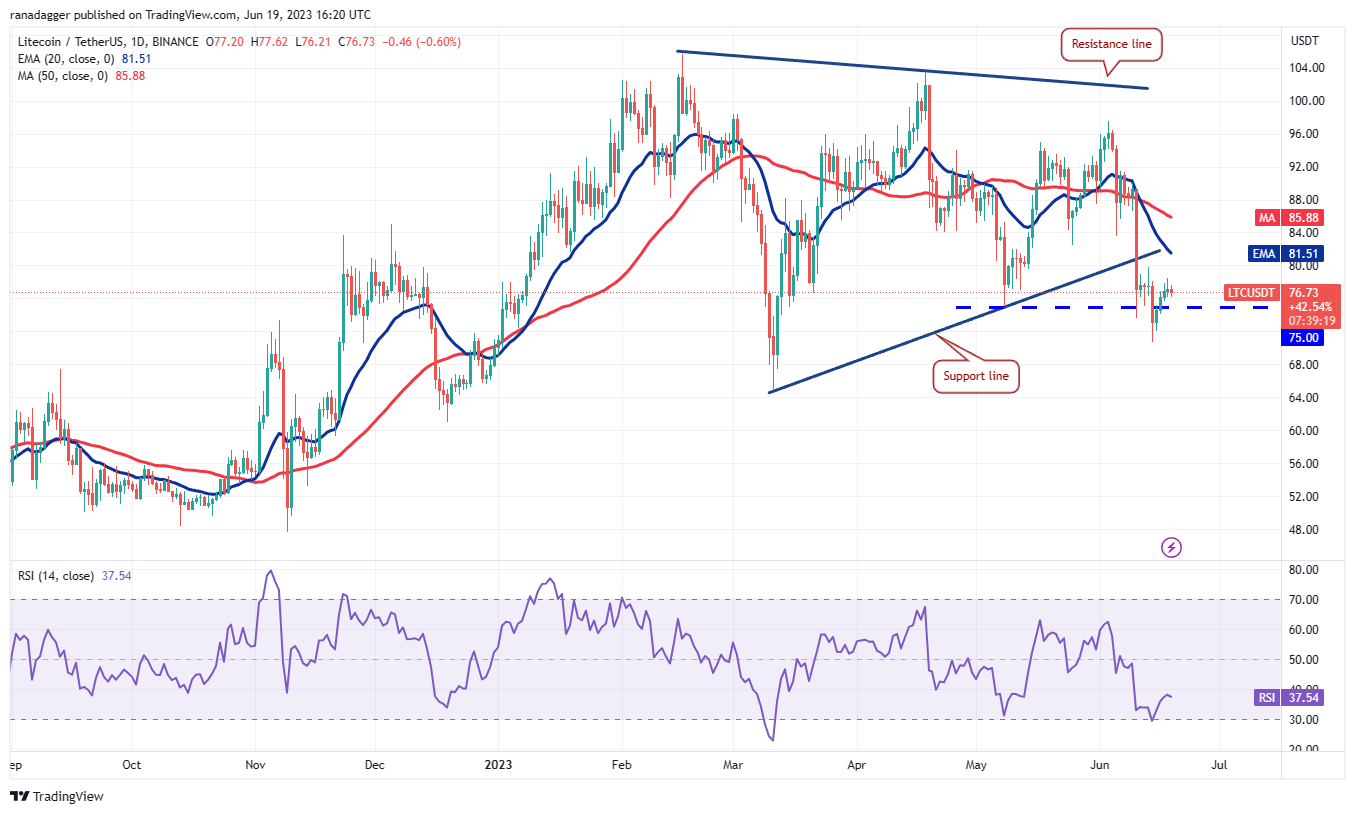
The bulls will try to push the price to the overhead resistance at the 20-day EMA ($81). This level is likely to witness strong selling by the bears, as they will try to maintain their control. If the price turns down from the current level or the 20-day EMA, it will open the doors for a possible retest of the support zone between $75 and $70.
Contrary to this assumption, if bulls shove the price above the 20-day EMA, it will indicate that the bears may be losing their grip. The LTC/USDT pair could then rally to $90.
This article does not contain investment advice or recommendations. Every investment and trading move involves risk, and readers should conduct their own research when making a decision.
This article is for general information purposes and is not intended to be and should not be taken as legal or investment advice. The views, thoughts, and opinions expressed here are the author’s alone and do not necessarily reflect or represent the views and opinions of Cointelegraph.


