Một báo cáo gần đây của công ty nghiên cứu Delphi Digital minh họa sự nhất quán có thể dự đoán được của hành động giá và xu hướng trong thị trường tiền điện tử. Báo cáo đi sâu vào mối liên hệ giữa chu kỳ Bitcoin (BTC) 4 năm và các xu hướng kinh
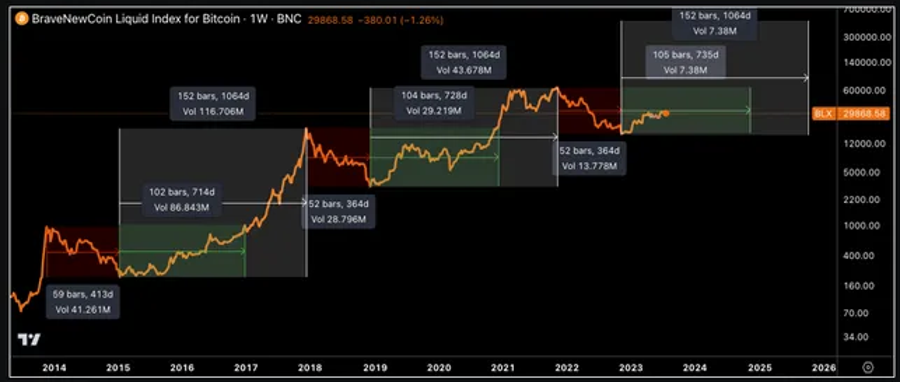
Theo các nhà phân tích của Delphi Digital, sự hợp nhất liên tục ở mức 30.000 đô la tương tự như giai đoạn từ năm 2015 đến năm 2017, với các chỉ số hướng tới mức cao nhất mọi thời đại sắp xảy ra đối với Bitcoin vào quý IV năm 2024.
Các chu kỳ kinh tế ảnh hưởng đến hiệu suất của Bitcoin
Delphi’s analysis draws attention to the inherent cyclical nature of the cryptocurrency market. This cyclicality is demonstrated by the timing between peak-to-trough bottoms, recovery periods to previous cycle highs and the timing of price rallies to new cycle tops. Using Bitcoin as a benchmark, Delphi outlines the general blueprint of a cryptocurrency market cycle.

These 4-year cycles include Bitcoin hitting a new ATH, experiencing an approximate 80% drawdown, followed by a bottom around one year later. This tends to be followed by a two-year recovery to prior highs, and finally, a price rally for another year leading to a new all-time high.
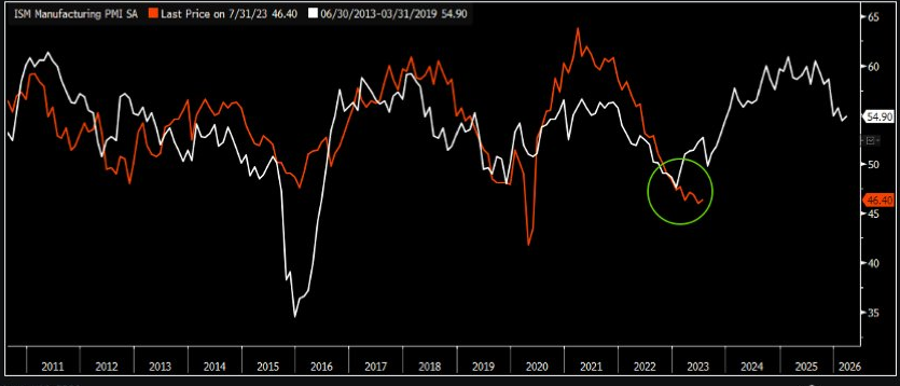
Nghiên cứu cho thấy mối tương quan hấp dẫn giữa đỉnh giá Bitcoin và những thay đổi trong chu kỳ kinh doanh, như được chỉ ra bởi Chỉ số Sản xuất ISM.

Trong thời gian đỉnh giá của Bitcoin, ISM thường có dấu hiệu tăng giá và các địa chỉ hoạt động, khối lượng giao dịch và phí đạt đến điểm cao nhất. Ngược lại, khi chu kỳ kinh doanh báo hiệu sự phục hồi, các mức hoạt động mạng cũng vậy.
Báo cáo nhấn mạnh vai trò của Bitcoin Halving trong các chu kỳ này. Hai đợt halving gần đây nhất xảy ra khoảng 18 tháng sau khi BTC chạm đáy và khoảng bảy tháng trước khi một ATH mới. Mô hình lịch sử này cho thấy một ATH mới dự kiến cho Bitcoin vào quý IV năm 2024, phù hợp với thời gian dự kiến của đợt halving tiếp theo
Bitcoin price action looks similar to theo 2015-2017 pre-bull run phase
The report also suggests that the current market environment shares striking similarities with the period between 2015 and 2017. The alignment of market behavior, economic indicators, and historical trends indicates that the current phase is akin to a time of increased risk exposure and potential growth, just as was experienced during that period.
Báo cáo lưu ý rằng các mô hình giao dịch của thị trường, đặc biệt là trong S&P 500, gần giống với quỹ đạo được quan sát trong giai đoạn 2015-2017. Ngay cả trong những thời điểm không chắc chắn, chẳng hạn như suy thoái thu nhập, những mô hình này vẫn tồn tại, phản ánh tâm lý của thời
The consistent pattern of Bitcoin’s cycle, its synchronization with broader economic shifts, and the imminent halving in 2024 all contribute to this thesis.

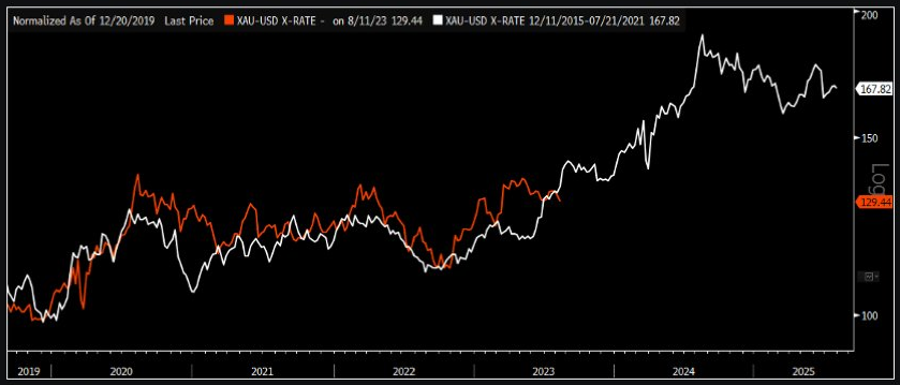
Delphi highlights parallels between the bleak global growth outlook during 2015-2016 and the recent period of economic uncertainty in 2021-2022. Factors such as the strength of the US dollar and changes in global liquidity cycles echo the past.
Báo cáo nhấn mạnh hiệu suất của vàng trong khoảng thời gian đó, bị ảnh hưởng bởi những lo ngại về suy giảm tiền tệ, thể hiện những điểm tương đồng đáng chú ý với hiện tại. Những điểm tương đồng này củng cố lập luận rằng các điều kiện kinh tế vĩ mô đang đi theo một

Liên quan: Sự biến động và suy giảm thấp kỷ lục của Bitcoin ở những người nắm giữ ngắn hạn có phải là tín hiệu thị trường tăng giá không?
Thị trường tiền điện tử phản ánh một triển vọng lạc quan, với một số dấu hiệu đỏ
Delphi’s analysis provides compelling evidence that the crypto market operates within cyclical patterns that mirror broader economic changes. The report’s prediction of a new all-time high by the fourth quarter of 2024 aligns with historical halving patterns. This timing, coupled with the state of indicators like the ISM and expectations of renewed liquidity cycles, strengthens the argument for a cycle akin to the one seen in 2015-2017.
The upcoming Bitcoin Halving in 2024 further adds credence to their expectations of a possible bull market by the fourth quarter of that year. While the analysis is not without its risks and uncertainties, the overall outlook for the cryptocurrency market in the next 12-18 months appears promising, given the stacking catalysts and historical precedent.
This article is for general information purposes and is not intended to be and should not be taken as legal or investment advice. The views, thoughts, and opinions expressed here are the author’s alone and do not necessarily reflect or represent the views and opinions of Cointelegraph.


