Bitcoin (BTC) đã cố gắng thoát ra khỏi phạm vi của nó trong nửa đầu tuần trước, nhưng phe bò không thể duy trì mức cao hơn. Bitcoin đã trở lại trong phạm vi và đang giao dịch gần mức 26,000 đô la
Hành động giá trong vài ngày qua đã hình thành hai mô hình nến Doji liên tiếp trên biểu đồ hàng tuần, cho thấy sự không chắc chắn về động thái định hướng tiếp theo.
Mặc dù rất khó để dự đoán hướng đột phá, nhưng nhược điểm có thể bị hạn chế trong thời gian tới do kỳ vọng rằng Ủy ban Chứng khoán và Giao dịch Hoa Kỳ (SEC) cuối cùng có thể phê duyệt một hoặc nhiều ứng dụng đang chờ xử lý cho một quỹ giao dịch trao đổi Bitcoin giao ngay.
Cựu chủ tịch ủy ban Jay Clayton có vẻ tự tin khi ông nói trong một cuộc phỏng vấn gần đây rằng “sự chấp thuận là không thể tránh khỏi.”
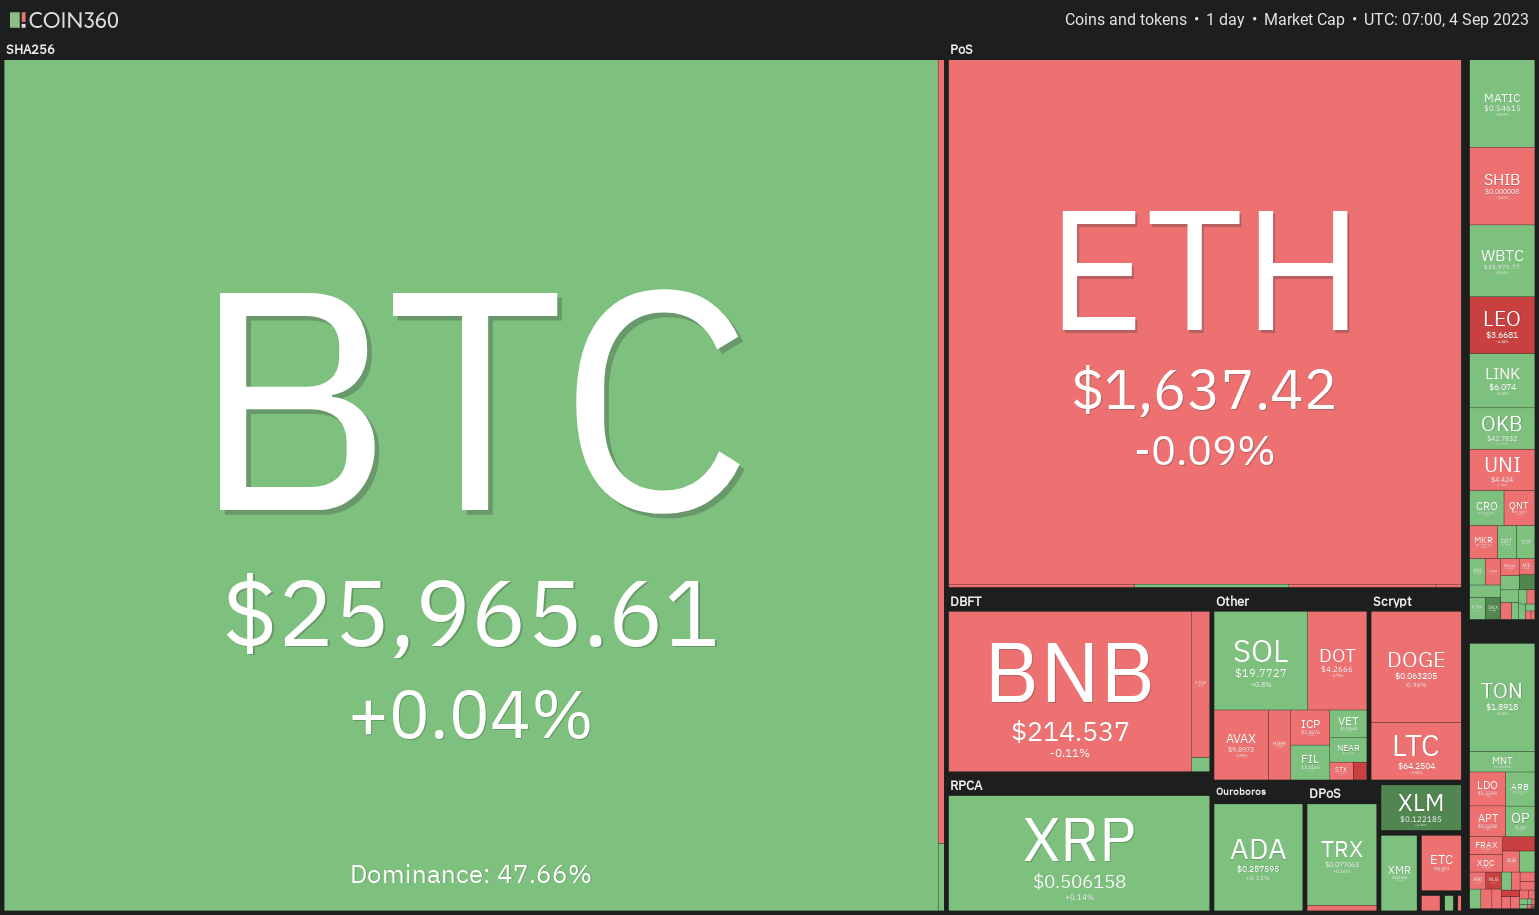
Trong thời gian tới, không dễ để xác định một chất xúc tác cụ thể có thể đẩy Bitcoin ra khỏi phạm vi của nó. Sự thiếu rõ ràng về động thái xu hướng tiếp theo của Bitcoin đã gây áp lực lên hầu hết
Chỉ có một số ít altcoin đang có dấu hiệu mạnh mẽ trong ngắn hạn. Hãy nghiên cứu biểu đồ của năm loại tiền điện tử hàng đầu có thể bắt đầu một đợt phục hồi nếu chúng vượt qua mức kháng cự trên tương ứng của chúng.
Phân tích giá Bitcoin
Bitcoin đã trở lại trong phạm vi $24,800 đến $26,833, nhưng một dấu hiệu tích cực là phe bò tiếp tục mua các mức giảm, như được thấy từ đuôi dài trên nến ngày 1 tháng 9.

Although the downsloping moving averages indicate advantage to bears, the gradually recovering relative strength index (RSI) shows that the bearish momentum may be weakening. The first sign of strength will be a break and close above the range at $26,833. If that happens, the BTC/USDT pair could retest the Aug. 29 intraday high of $28,142.
If bears want to seize control, they will have to sink and sustain the price below $24,800. This is going to be tough as the bulls are likely to defend the level with all their might. Still, if the bears prevail, the pair can plunge to $20,000. There is a minor support at $24,000 but it may not halt the decline.
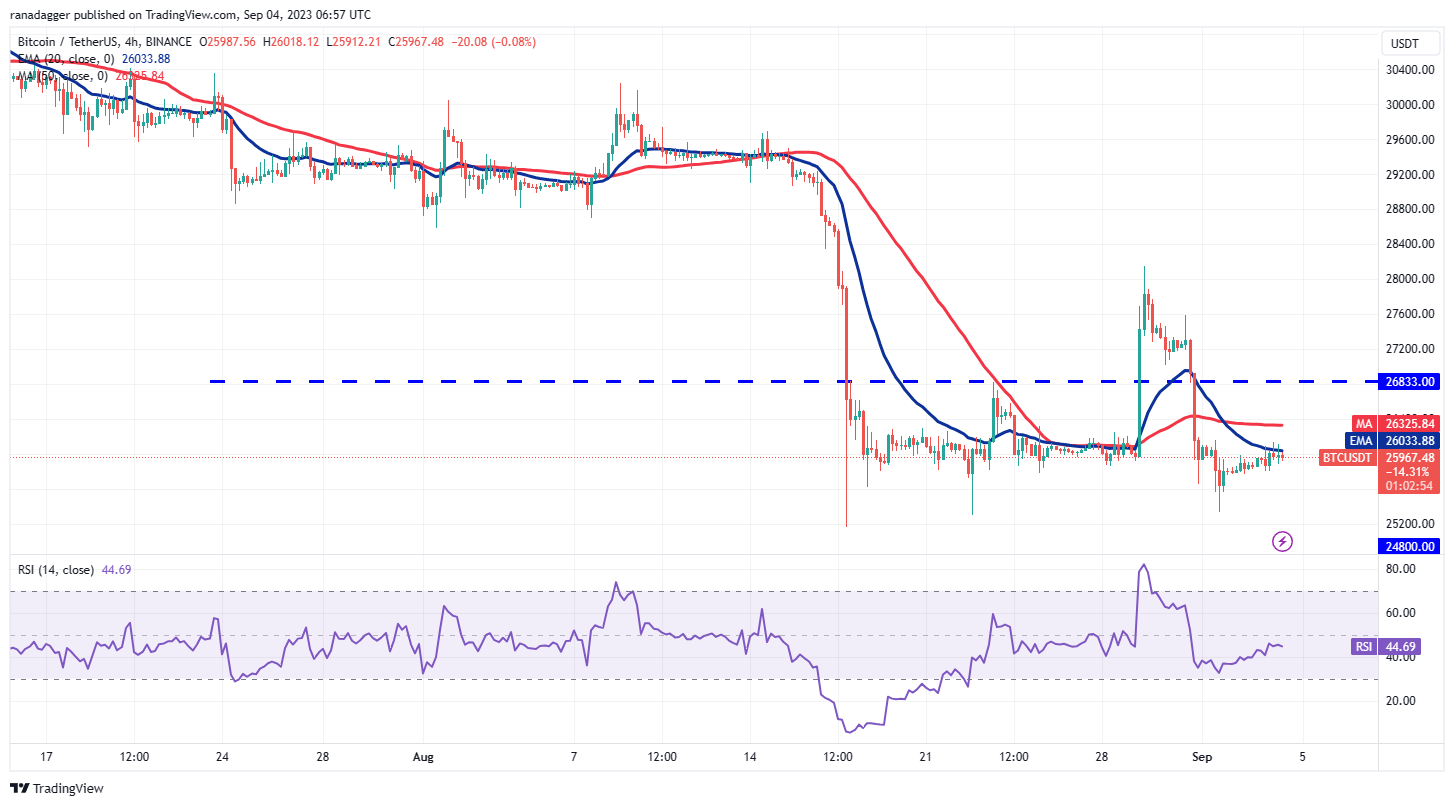
he gấu đã cố gắng kéo giá xuống dưới mức hỗ trợ ngay lập tức ở mức 25,300 đô la nhưng phe bò đã giữ vững lập trường của họ. Tiếp theo, người mua sẽ cố gắng củng cố vị thế của họ bằng cách đẩy giá lên trên đường trung bình động 20 cấp số nhân. Nếu họ làm điều đó, nó sẽ cho thấy sự khởi đầu của một sự phục hồi mạnh mẽ hơn.
Đường trung bình động đơn giản 50 ngày có thể hoạt động như một rào cản nhưng nó dự kiến sẽ được vượt qua. Cặp tiền này sau đó có thể tăng lên mức kháng cự trên 26,833 USD
Người bán có thể có kế hoạch khác. Họ sẽ cố gắng giảm giá xuống dưới 25.300 đô la và thách thức mức hỗ trợ quan trọng ở mức 24.
Toncoin price analysis
Toncoin (TON) is in an uptrend but the bears are trying to halt the up-move near the overhead resistance at $2.07.
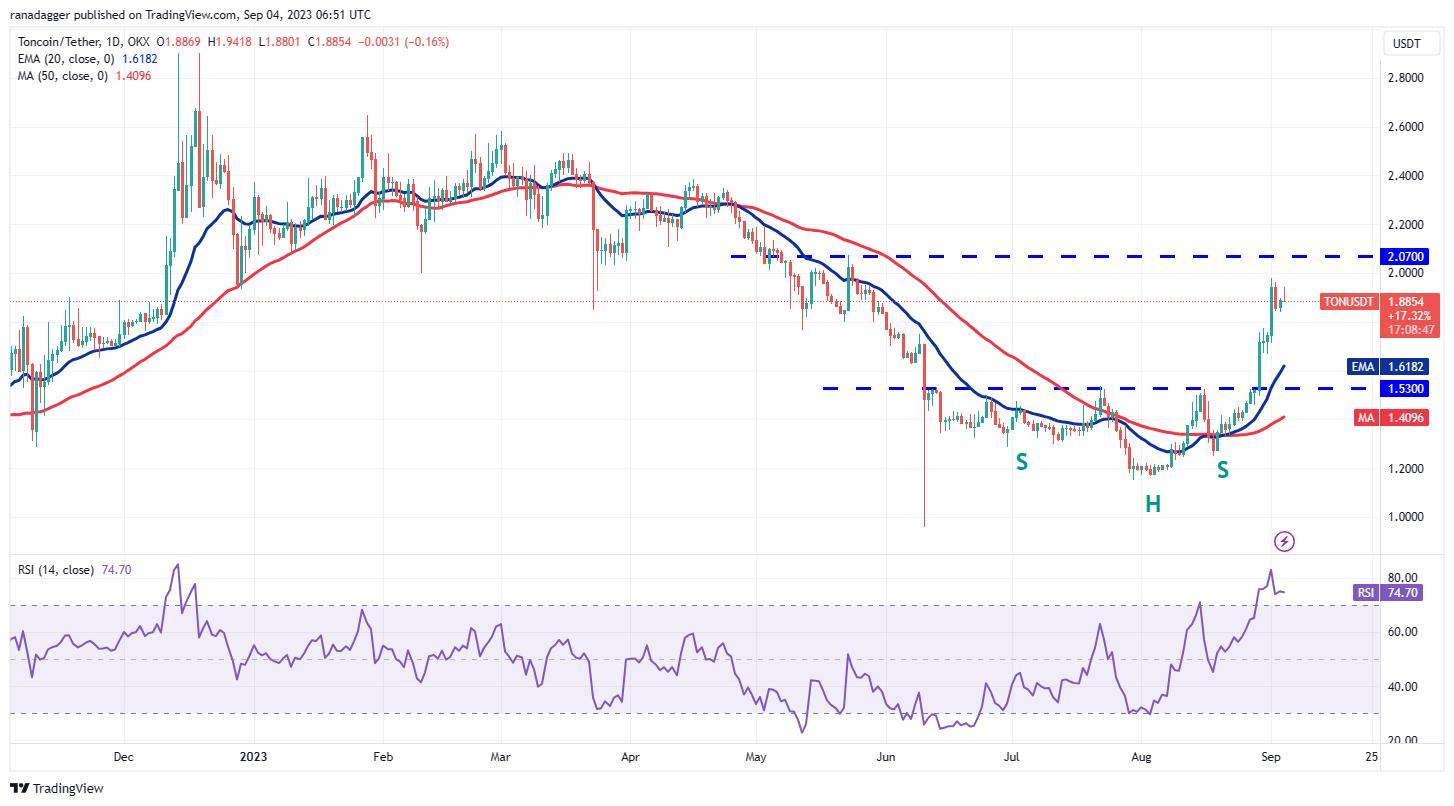
Cả hai đường trung bình động đều tăng lên, cho thấy lợi thế cho người mua nhưng mức quá mua trên RSI cho thấy có thể điều chỉnh hoặc củng cố nhỏ. Nếu phe bò không từ bỏ nhiều điểm so với mức hiện tại, khả năng tăng trên $2.07 sẽ tăng lên. Cặp TON/USDT sau đó có thể tăng vọt lên $2.40
Ngược lại, một sự điều chỉnh sâu hơn có thể kéo giá đến đường EMA 20 ngày ($1.61). Một sự phục hồi mạnh mẽ từ mức này sẽ cho thấy tâm lý vẫn tích cực và các nhà giao dịch đang mua khi giảm. Xu hướng sẽ chuyển sang tiêu cực nếu đường hỗ trợ EMA 20 ngày
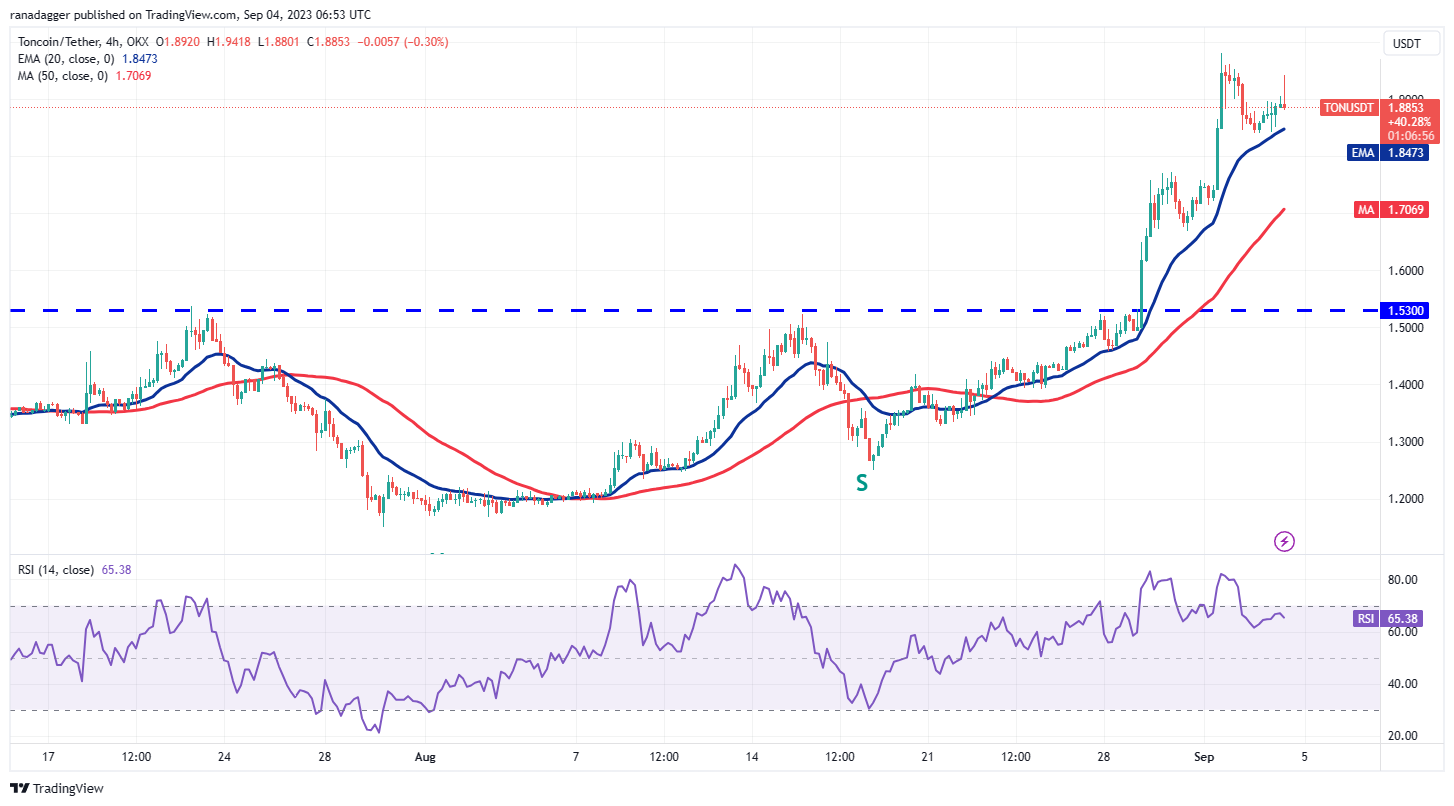
The 4-hour chart shows that the bulls have been buying the pullback to the 20-EMA. Buyers will have to push the price above $1.98 to signal the resumption of the uptrend but the bears may not give up easily.
Sellers will try to pull the price below the 20-EMA. If they manage to do that, the pair could start a deeper pullback toward the 50-SMA. A bounce off this level is likely to face selling at the 20-EMA but if this roadblock is cleared, it will suggest that bulls are back in the driver’s seat.
Chainlink price analysis
Chainlink (LINK) has been trading inside a large range between $5.50 and $9.50 for the past several months. The bears pulled the price below the support of the range on June 10 but they could not sustain the lower levels.
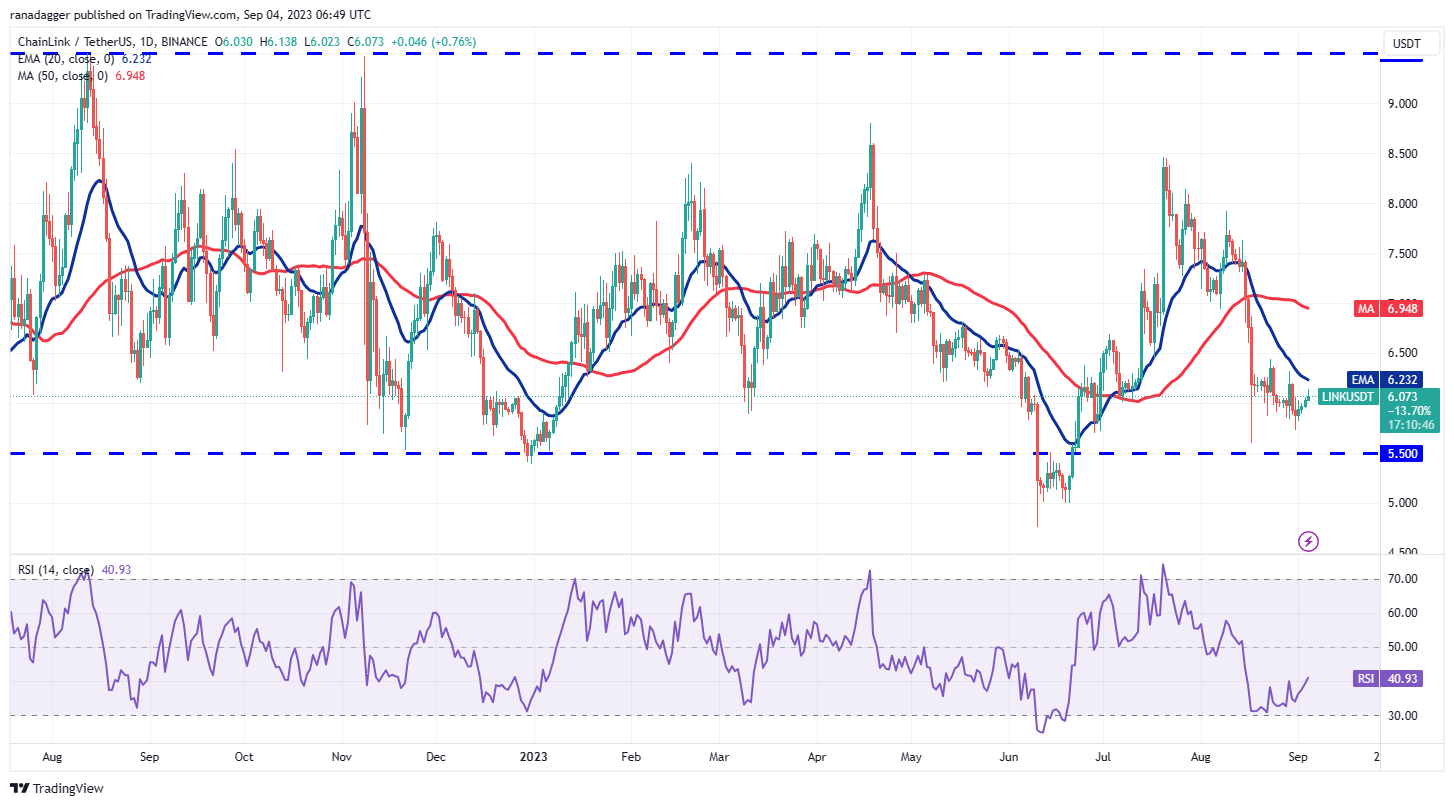
The LINK/USDT pair dropped close to the support of the range on Aug. 17 but the bulls bought this dip as seen from the long tail on the day’s candlestick. Buyers are trying to start a recovery but are facing resistance near the 20-day EMA ($6.23). Hence, this becomes an important level to look out for.
If buyers propel the price above the 20-day EMA, the pair can start its journey toward the 50-day SMA ($6.94). There is a minor resistance at $6.40 but it is likely to be crossed.
On the contrary, if the price turns down sharply from the 20-day EMA, it will suggest that the sentiment remains negative and traders are selling on rallies. That could pull the price down to $5.50.
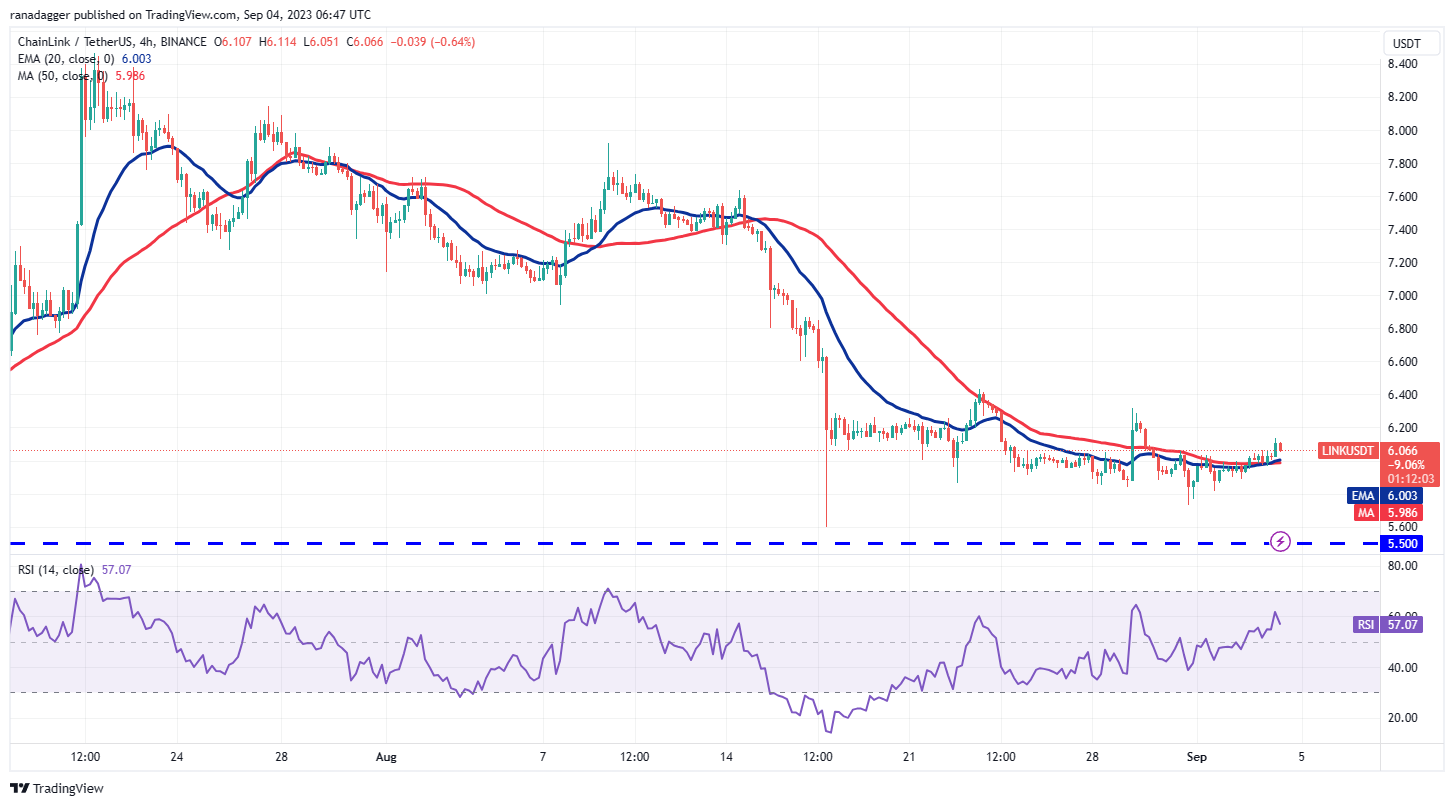
The moving averages have flattened out on the 4-hour chart and the RSI is just above the midpoint. This suggests that the selling pressure is reducing. Buyers will have to kick the price above $6.40 to start a new up-move. The pair could first rise to $6.87 and later to $7.07.
Alternatively, if the price turns down from $6.40, it will signal that bears are selling on rallies. That may keep the pair range-bound between $5.50 and $6.40 for a while longer.
Liên quan: Shibarium đạt 1 triệu ví trong bối cảnh tăng trưởng vượt bậc, SHIB vẫn chưa bắt kịp
Maker price analysis
Maker (MKR) has taken support near $1,000 but the bulls are facing solid resistance from the bears near the downtrend line.
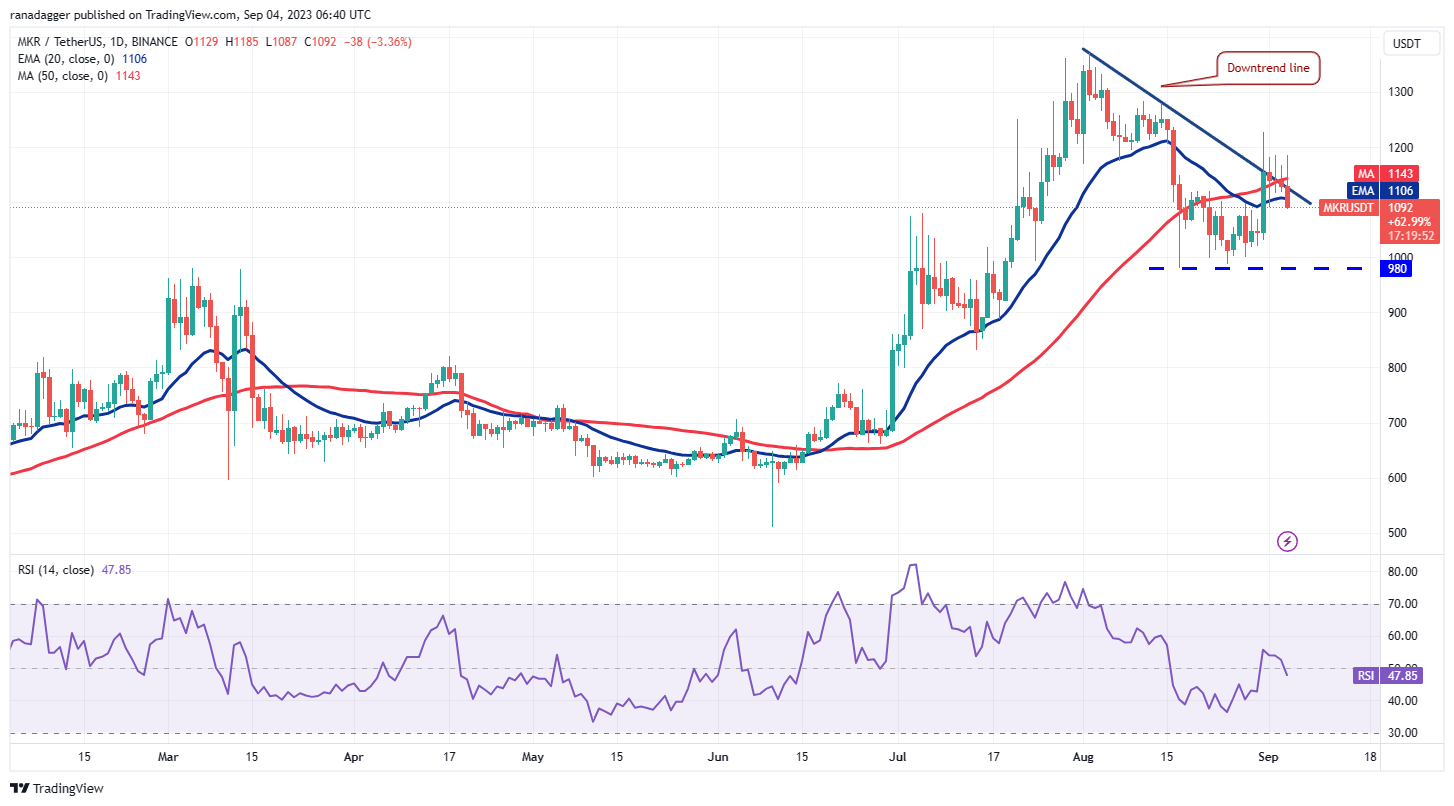
The bulls repeatedly pushed the price above the downtrend line in the past few days but they failed to sustain the higher levels. A minor positive is that buyers have not given up much ground, which suggests that traders are not dumping their positions in a hurry.
If the price turns up and closes above the downtrend line, it will suggest that buyers are back in the game. The positive momentum is likely to pick up after buyers kick the price above $1,227. The pair may then rally to $1,370.
Instead, if the price sustains below the 20-day EMA ($1,106), it will suggest that bears have the upper hand. The pair could then slump to the strong support at $980.
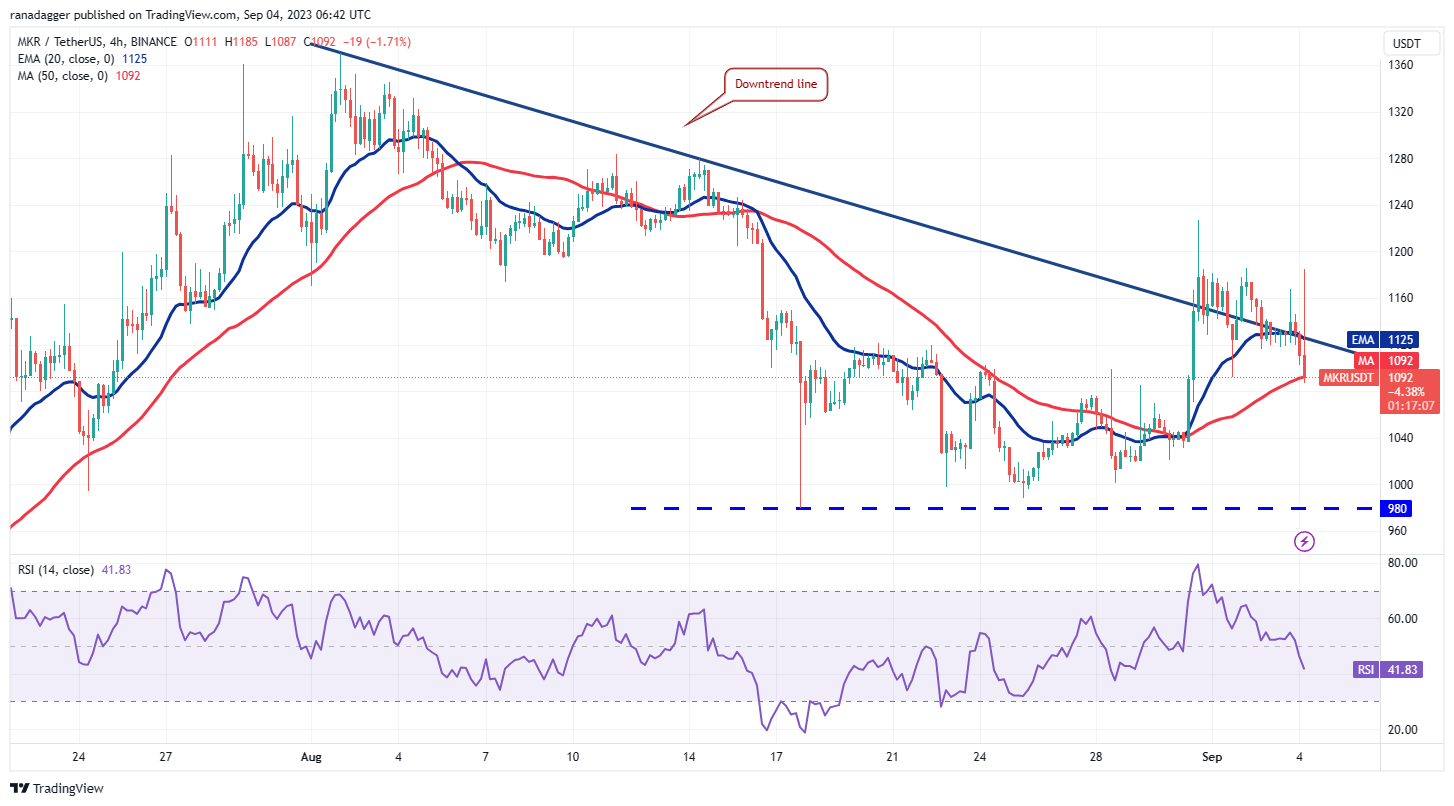
The 4-hour chart shows that the bulls pushed the price above the downtrend line but they could not sustain the higher levels. This indicates that the bears have not given up and they continue to sell on rallies.
The price has plunged to the 50-SMA, which is an important level to keep an eye on. If the price turns up from the current level, the bulls will again try to overcome the obstacle at $1,186 and then at $1,227. If this zone is scaled, the rally could reach $1,280.
Conversely, if the price sustains below the 50-SMA, it will open the gates for a potential decline to $1,040 and eventually to $980.
Tezos price analysis
Tezos (XTZ) has been witnessing a tussle between the bulls and the bears near the strong support at $0.70. The failure of the bears to sink and sustain the price below this level indicates buying at lower levels.
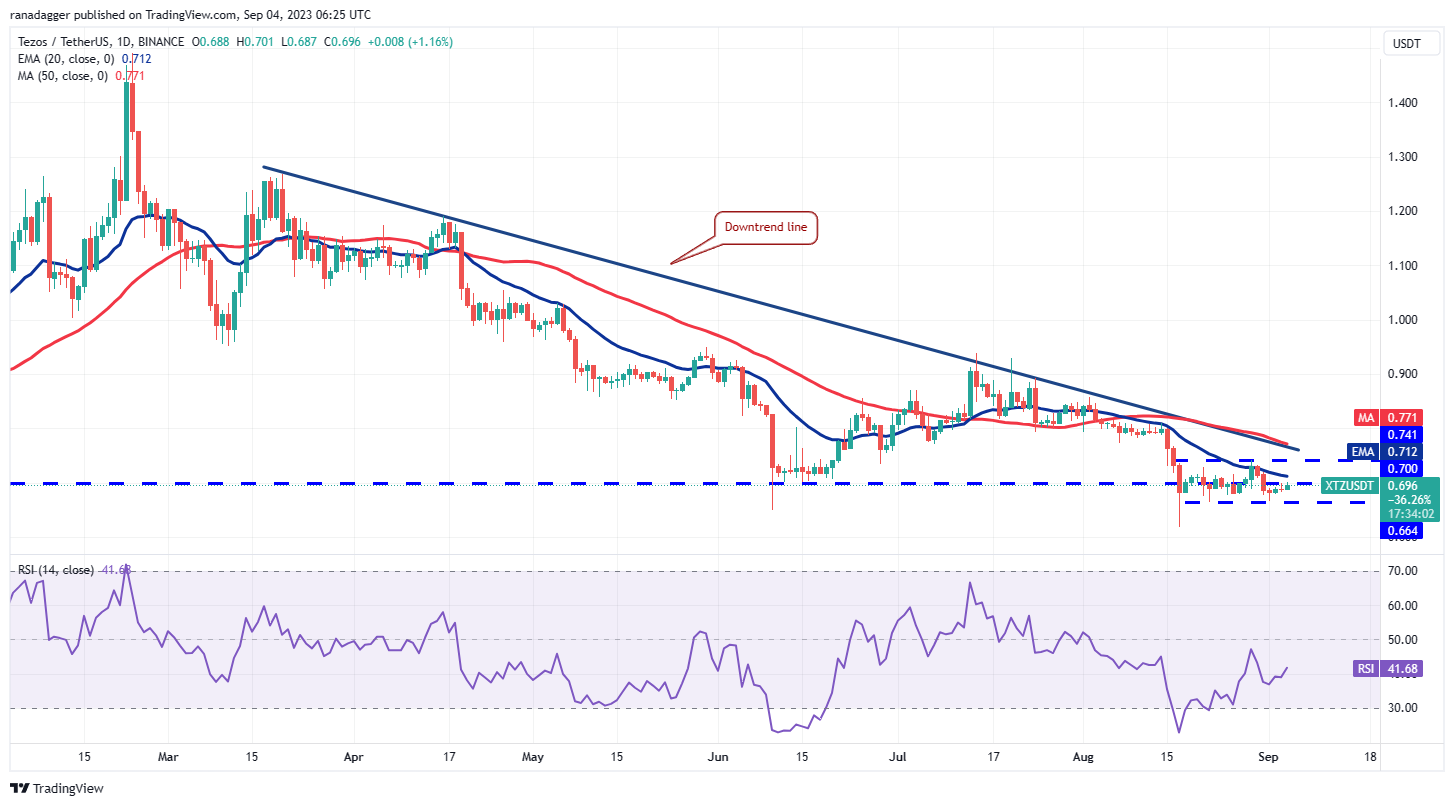
The downsloping moving averages indicate advantage to bears but the rising RSI suggests that the bearish momentum is reducing. A close above the 20-day EMA ($0.71) will be the first sign of strength. That could pave the way for a rally to the downtrend line.
This level is likely to act as a formidable hurdle but if the bulls overcome it, the XTZ/USDT pair may start a new up-move. The pair can first rally to $0.94 and subsequently to $1.04. This positive view will invalidate if the price skids and sustains below $0.66.
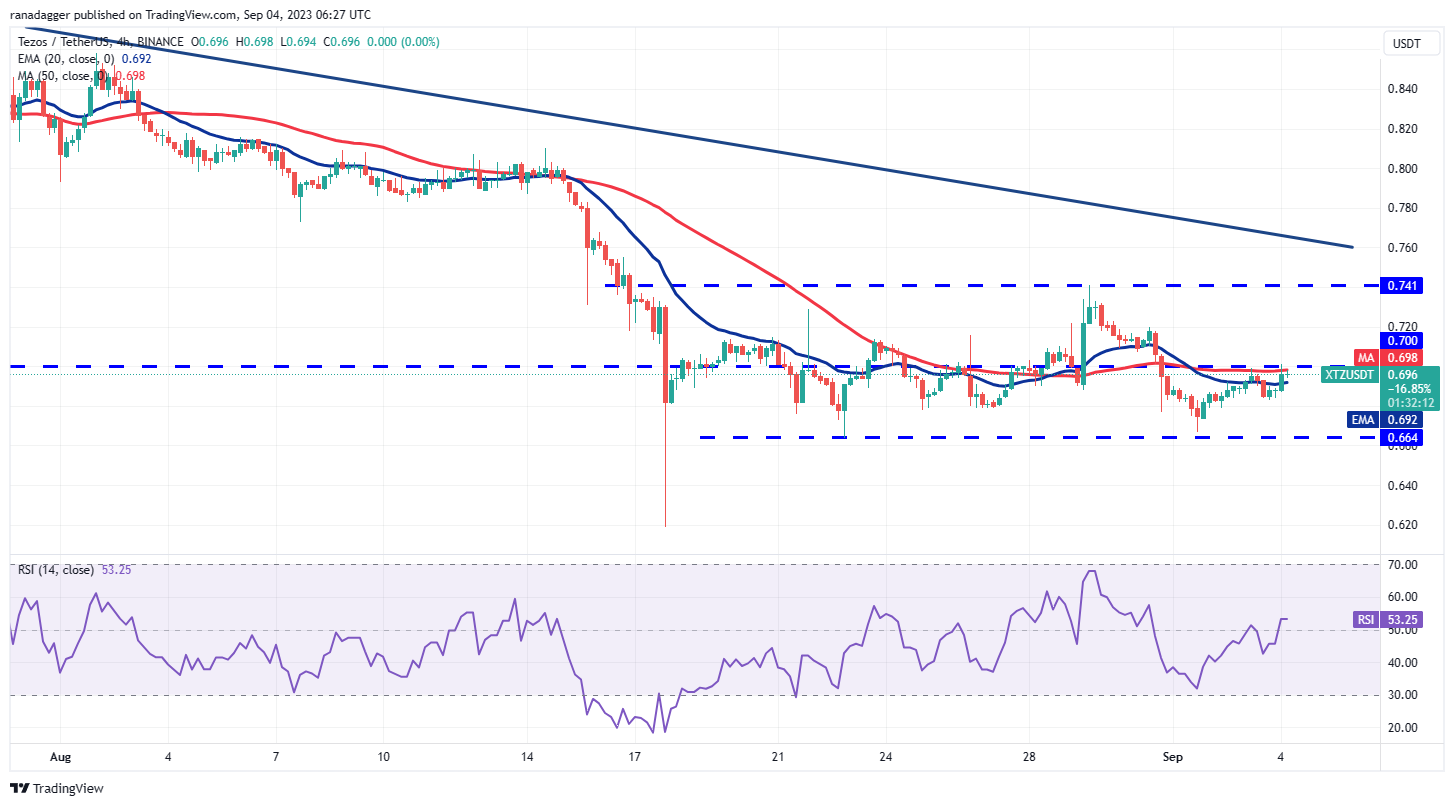
The 4-hour chart shows that the price is consolidating between $0.70 and $0.66. The crisscrossing moving averages and the RSI near the midpoint indicate a balance between supply and demand.
If the price rises above $0.70, the advantage will tilt in favor of the bulls. The pair could then surge to the overhead resistance at $0.74. The advantage will tilt in favor of the bears if they sink the price below $0.68. That is likely to result in a retest of the support at $0.66. If this level crumbles, the pair may start the next leg of the downtrend to $0.61.
This article does not contain investment advice or recommendations. Every investment and trading move involves risk, and readers should conduct their own research when making a decision.


