tài sản rủi ro mở rộng một chút động thái tăng giá của chúng trong tháng Tư. Chỉ số S&P 500 đã tăng khoảng 1.5% trong tháng Tư trong khi Bitcoin (BTC) đang trên đà kết thúc tháng với mức tăng hơn 4%. Liệu đà tăng có thể tiếp tục trong tháng 5 hay đã đến lúc pullback
?
Sự phục hồi có thể phải đối mặt với những cơn gió ngược nếu các vấn đề ngân hàng của Hoa Kỳ leo thang hơn nữa. Giám đốc đầu tư của JPMorgan Asset Management Bob Michele cho biết trong một cuộc phỏng vấn với Bloomberg rằng tình trạng hỗn loạn tại Ngân hàng First Republic khó có thể chỉ giới hạn ở ngân hàng và có thể gây ra hiệu ứng domin

Nếu điều đó xảy ra, thì thị trường chứng khoán Hoa Kỳ có thể chứng kiến một sự điều chỉnh. Tuy nhiên, rất khó để dự đoán Bitcoin sẽ phản ứng như thế nào với một cuộc khủng hoảng như vậy bởi vì, trong vài ngày qua, giá BTC đã tăng trong khi những rắc rối ngân hàng kế thừa ngày càng sâu sắc. Nhưng trong trường hợp có một biến động lớn trong lĩnh vực ngân hàng Hoa Kỳ, có thể Bitcoin cũng sẽ phải đối mặt với một sự điều chỉnh sớm hay muộn
Trong thời gian tới, Bitcoin và các altcoin chọn lọc đang cho thấy sức mạnh. Hãy nghiên cứu biểu đồ của năm loại tiền điện tử có thể hoạt động tốt hơn trong vài ngày tới
Phân tích giá Bitcoin
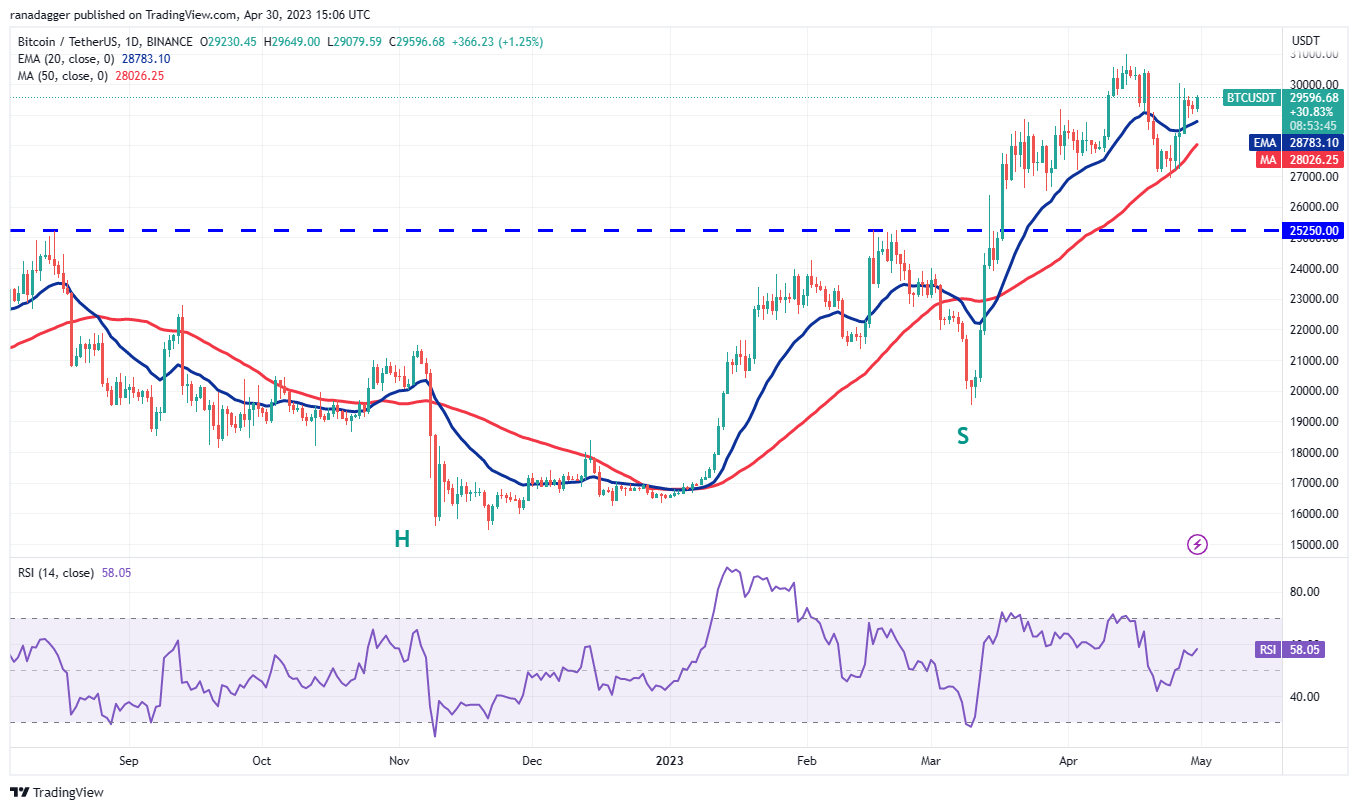
Sau hai ngày giao dịch biến động thấp trong Bitcoin, phe bò đang cố gắng khẳng định quyền tối cao của họ vào ngày 30 tháng 4.

The 20-day exponential moving average ($28,783) has started to turn up gradually and the relative strength index (RSI) is in the positive zone, indicating that the path of least resistance is to the upside.
Nếu phe bò đẩy giá Bitcoin lên trên 30,000 đô la, cặp BTC/USDT có thể leo lên vùng kháng cự trên $31,000 đến $32,400. Người mua có thể phải đối mặt với ngưỡng kháng cự đáng gờm tại vùng này nhưng nếu nó bị vượt qua, cặp tiền này có thể tăng vọt lên mức 40,000 đô
The 50-day simple moving average ($28,026) is the important support to keep an eye on. If BTC price collapses below this level, the bears will sense an opportunity and try to sink the pair to $25,250.

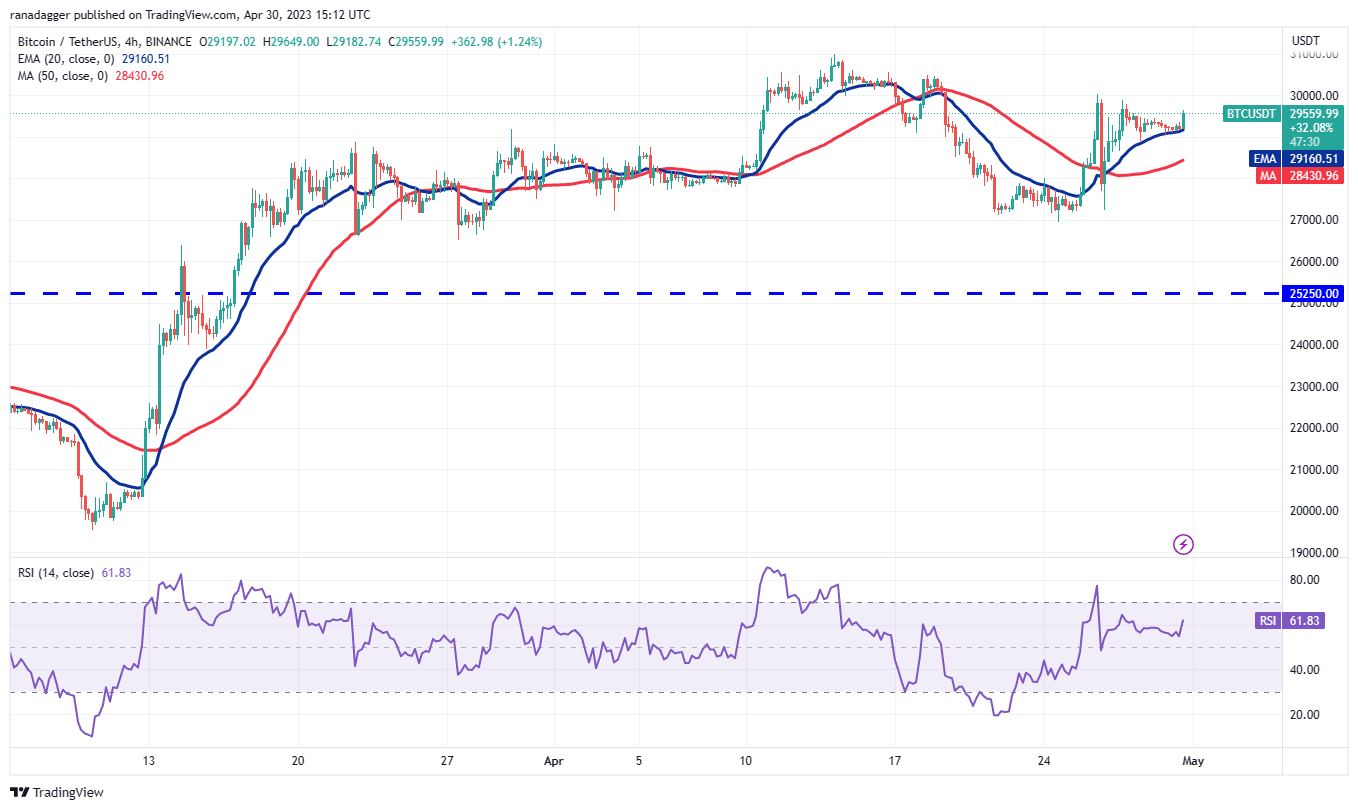
Những con gấu đã cố gắng kéo cặp tiền xuống dưới đường 20 EMA nhưng phe bò vẫn giữ vững lập trường của họ. Điều này có thể đã thu hút thêm người mua và phe bò tiếp theo sẽ cố gắng đẩy giá lên trên 30.000 đô la. Nếu họ thành công, Bitcoin có thể tăng lên 30.500 đô la,
Ngược lại, nếu giá giảm và phá vỡ dưới đường EMA 20, nó sẽ cho thấy phe gấu đang bán gần các mức kháng cự trên. Sau đó, cặp tiền này có thể trượt xuống 50-SMA
Phe bò sẽ cố gắng bảo vệ mức này nhưng nếu những con gấu áp đảo chúng, điểm dừng tiếp theo có thể là 27.000 đô la. Người mua có khả năng bảo vệ khu vực giữa 27.000 đô la và 25,250 đô la
Phân tích giá Solana
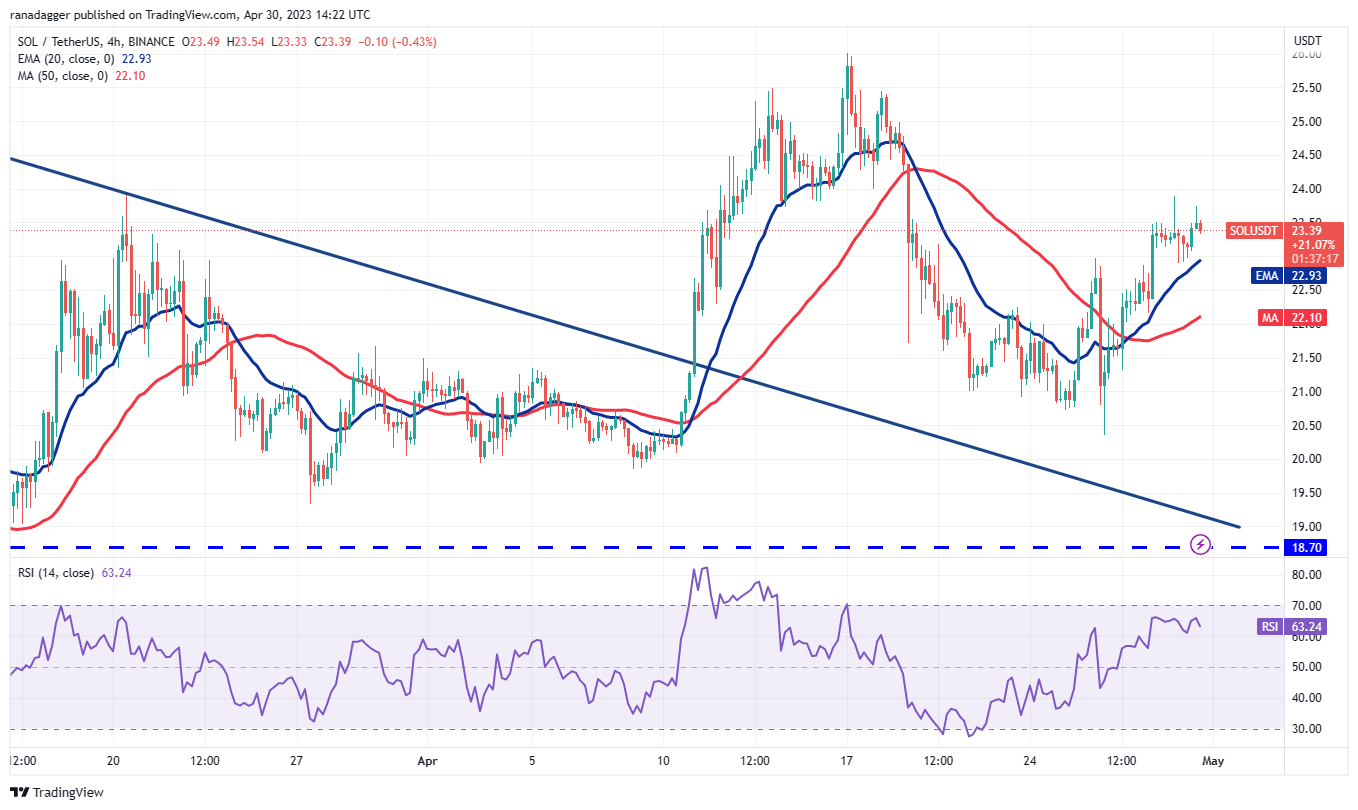
Phe bò đã không cho phép Solana (SOL) bứt phá trở lại dưới đường xu hướng giảm trong đợt điều chỉnh gần đây nhất, cho thấy nhu cầu ở các mức thấp hơn.

Buyers will next try to propel the price to the overhead resistance at $27.12. This remains the key resistance to watch for in the near term because if bulls catapult the price above it, the SOL/USDT pair may accelerate toward $39.
Quan điểm tăng giá này có thể vô hiệu trong ngắn hạn nếu giá giảm và phá vỡ dưới đường trung bình động. Cặp tiền này sau đó có thể giảm mạnh xuống mức hỗ trợ quan trọng ở mức 18.70 USD. Nếu giá phục hồi khỏi mức này, nó sẽ báo hiệu rằng cặp tiền có thể dao động trong phạm vi lớn giữa $18,70 và $

Các đường trung bình động trên biểu đồ 4 giờ đã bắt đầu tăng và chỉ số RSI nằm trong vùng tích cực, cho thấy rằng người mua đang kiểm soát. Phe gấu đang cố gắng ngăn chặn sự phục hồi ở mức 24 đô la nhưng nếu phe bò vượt qua rào cản này, cặp tiền này có thể lấy đà và tăng lên
If the bears want to prevent the rally, they will have to quickly tug the price back below the 20-EMA. The 50-SMA will be the support level to watch here if price begins to slide.
Cosmos price analysis
The long tail on Cosmos’ (ATOM) April 26 candlestick shows that the bulls are fiercely defending the support at $10.20.

Buyers have pushed the price above the moving averages and will try to reach the downtrend line. This is an important level to keep an eye on because a break and close above it will open the doors for a potential rally to $13.50 and then to $15.50.
On the other hand, if the ATOM/USDT pair reverses direction from the downtrend line, it will suggest that bears are trying to form a descending triangle pattern. A decline below the moving averages will open the doors for a possible retest of $10.20.

The 20-EMA on the 4-hour chart has turned up and the RSI is near the overbought zone, indicating that bulls are in control. There is a minor hurdle at $12.13 but that is likely to be crossed. ATOM price may then rise to test the downtrend line.
Instead, if the price turns down from $12.13, the bears will again try to sink the pair below the 20-EMA. If they manage to do that, it will suggest that the buyers may be losing their grip. The pair then risks a slide to the 50-SMA.
Related: ‘Good luck bears’ — Bitcoin traders closely watch April close with BTC price at $29K
Internet Computer price analysis
Internet Computer (ICP) slipped below the 50-day SMA ($5.38) on April 26 but that proved to be a bear trap. The price turned up on April 27 and started a strong recovery.

The 20-day EMA ($5.74) has started to turn up and the RSI has jumped into positive territory, indicating that bulls have a slight edge. If the price does not give up much ground from the current level or rebounds off the 20-day EMA, it will suggest that the bulls are buying the dips.
That will enhance the prospects of a rally to the downtrend line where the bears will again mount a strong defense. On the downside, a break below the 50-day SMA will tilt the advantage in favor of the bears.

The 4-hour chart shows that the ICP/USDT pair is in a corrective phase. The first support is at the 20-EMA, which is close to the 38.2% Fibonacci retracement level of $6.14. If the price bounces off this support, the pair may rally to $7.23 and eventually to $7.70.
Contrary to this assumption, if the price continues lower and breaks below the 20-EMA, it will suggest that the short-term bulls may be booking profits. That could pull the price to the 50-SMA, which is near the 61.8% retracement level of $5.72.
Hedera price analysis
The bears repeatedly tried to sink Hedera (HBAR) below $0.06 but the bulls held their ground. The failure to break the support attracted buyers who will try to push the price above the downtrend line.

The 20-day EMA ($0.06) is flattening out and the RSI has climbed above the midpoint, indicating that the selling pressure is reducing. If buyers thrust the price above the resistance line, the bullish momentum may pick up and the HBAR/USDT pair could rally to the overhead resistance at $0.08.
Contrarily, if the price turns down from the current level or the resistance line, it will suggest that the bears remain active at higher levels. That increases the possibility of a break below $0.06.

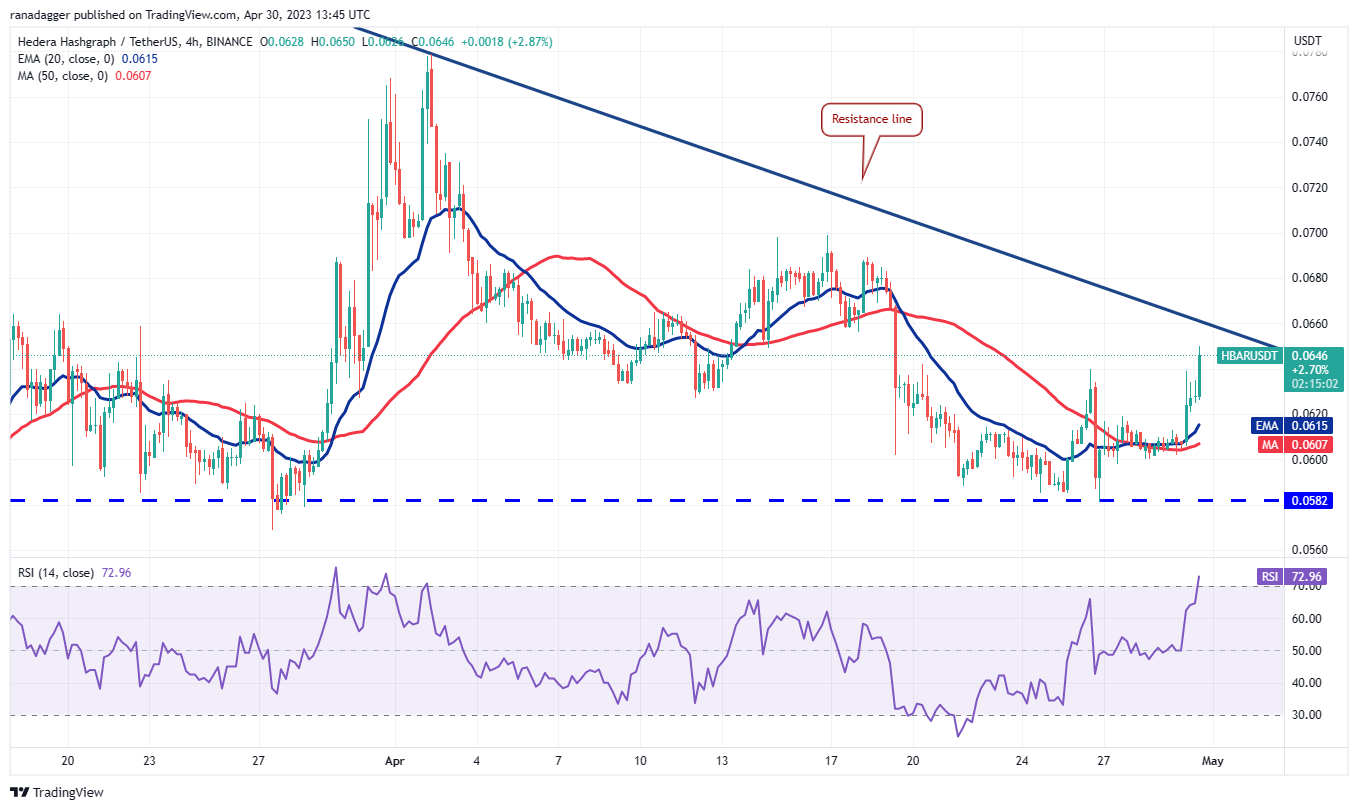
The 4-hour chart shows that the bulls flipped the moving averages into support and have launched an up-move that is likely to reach the resistance line. This level is expected to act as a strong resistance but on the way down, if the pair rebounds off the 20-EMA, it will suggest a change in sentiment from selling on rallies to buying on dips.
The pair may then break above the resistance line and start its journey to $0.07 and subsequently to $0.08. If the bears want to gain the upper hand, they will have to quickly pull HBAR price below the moving averages.
This article does not contain investment advice or recommendations. Every investment and trading move involves risk, and readers should conduct their own research when making a decision.


