Bitcoin (BTC) bắt đầu một tuần mới chỉ dưới $22,000 khi bulls không thể chiếm lại được điểm đã mất trong tháng Hai.
Sau một số biến động khiêm tốn đối với mức đóng cửa hàng tuần, BTC/USD vẫn ở gần mức thấp nhất trong ba tuần khi một hiện trạng mới đi vào với mức kháng cự $22,000.
Tiền điện tử lớn nhất đứng đầu một tuần quan trọng của dữ liệu kinh tế vĩ mô, tuy nhiên, với rất nhiều cơ hội cho sự biến động để trở lại.
Những điều này xuất hiện đầu tiên và quan trọng nhất dưới dạng Chỉ số Giá tiêu dùng Hoa Kỳ (CPI), bản in tháng Một sẽ được công bố vào ngày 14 tháng 2.
bản in dữ liệu khác sẽ theo dõi trong suốt tuần, và các nhà phân tích đang chú ý đến phản ứng của thị trường crypto, cùng với đồng đô la Mỹ.
vòng tròn Bitcoin, cá voi đang tận dụng cơ hội mua ở mức hiện tại, dữ liệu cho thấy, trong một tia hy vọng cho những người hy vọng rằng sự phục hồi giá Bitcoin 2023 có thể tiếp tục.
Đồng thời, một sự kiện biểu đồ mới đáng gờm đang gây khó chịu cho một số người – liệu Bitcoin có thể tránh được nhược điểm đáng kể khi “chéo chết” hàng tuần đầu tiên của nó khẳng định?
Cointelegraph có một cái nhìn vào những vấn đề này và nhiều hơn nữa trong tiêu hóa hàng tuần của các kích hoạt tiềm năng của thị trường Bitcoin trong tuần tới.
Bitcoin xác nhận biểu đồ hàng tuần “sự cố”
Tại khoảng $21,800, đóng cửa hàng tuần mới nhất đã có vài bất ngờ trong cửa hàng cho những người ở hai bên của giao dịch Bitcoin, dữ liệu từ Cointelegraph Markets Pro và TradingView cho thấy.
thấp nhất kể từ giữa tháng Một, sự kiện này đã đóng dấu sự hồi phục được chờ đợi từ lâu đối với BTC/USD sau khi nó trải qua tháng Một trải qua xu hướng tăng thực tế không được kiểm soát.
Bây giờ, sự chú ý đang tập trung vào các mức hỗ trợ chính nắm giữ, chủ yếu dưới dạng các đường xu hướng dài hạn trở lại như hỗ trợ trong giai đoạn đầu tháng Một.
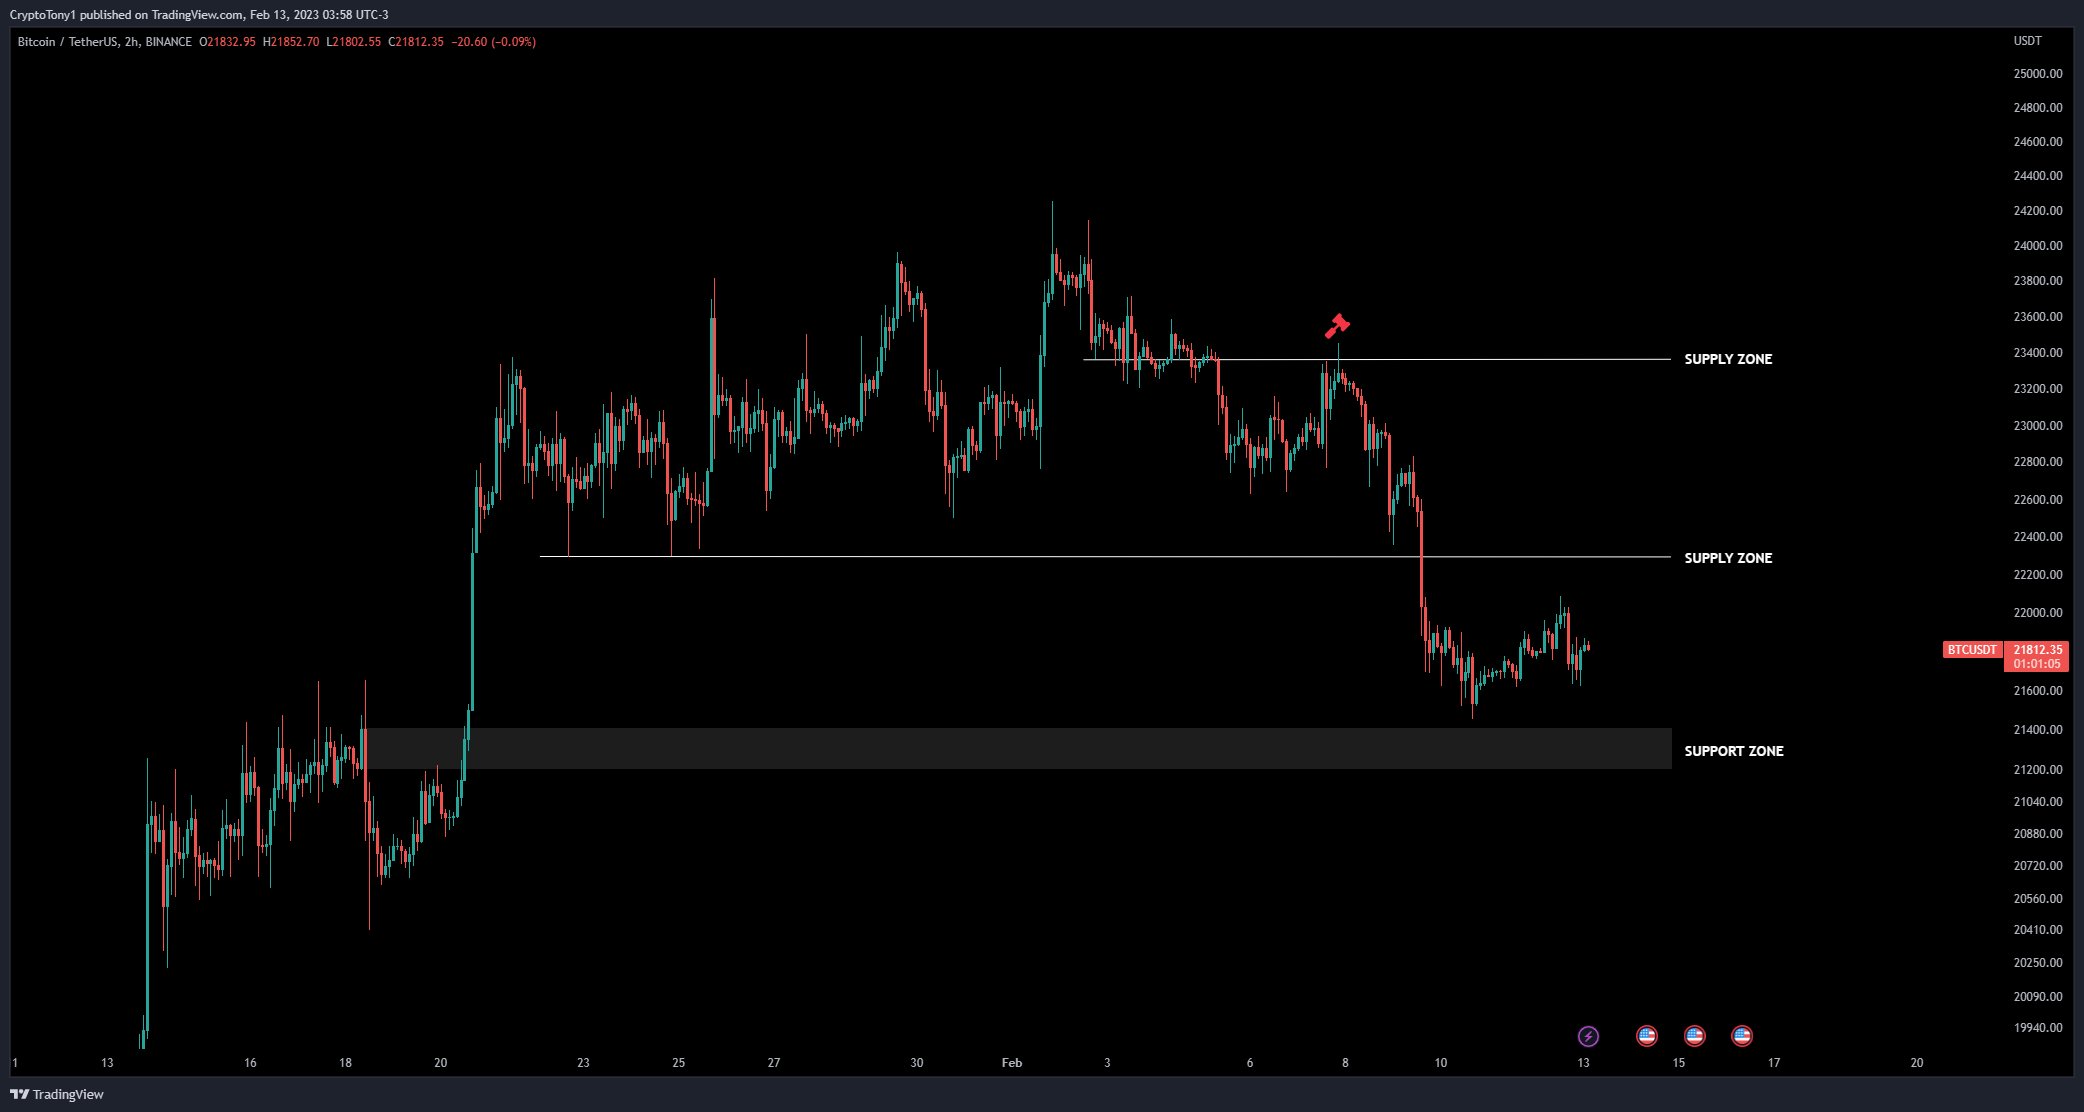
Trong một bản cập nhật mới cho những người theo dõi Twitter vào ngày 13 tháng 2, nhà giao dịch nổi tiếng Crypto Tony xác nhận rằng 21.400 $ là nơi tình hình có thể trở nên thú vị.
“Từ đó chúng ta có thể thực sự đánh giá liệu những con bò đực có nó trong họ để cứu những con gấu, hoặc dẫn chúng đến giết mổ”, một phần của bài bình luận đọc.
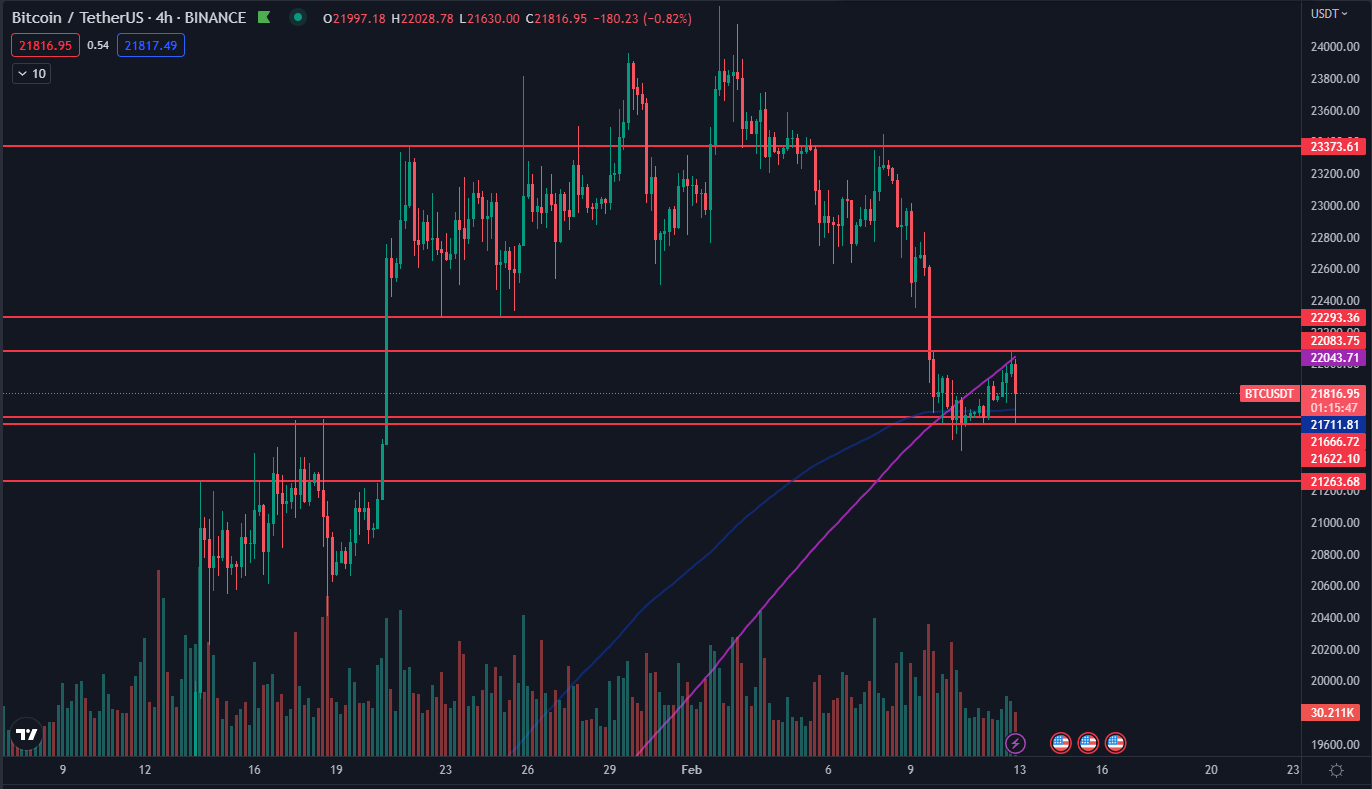
óng to, tài khoản đồng nghiệp Daan Crypto Trades lưu ý rằng BTC/USD nằm giữa đường trung bình động cấp số mũ (EMA) chu kỳ 200 và 400 trên khung thời gian 4 giờ.
“Có vẻ như chúng tôi sẽ mở ra với một khoảng trống nhỏ bên dưới chúng tôi khi chúng tôi nói chuyện. Nhìn chung chỉ là một ngày cuối tuần choppy cho BTC với một số alt popping. Đang chờ CPI. Có lẽ sẽ không thực hiện nhiều hành động trước đó”, ông tóm tắt.
Một dòng ghê gớm hơn trên cát trong khi đó đi kèm trong các hình thức MA 200 ngày. Mặc dù vẫn ở mức $20,000, mức này hiện nay tạo thành một mức quan trọng để giữ cho những con bò vẫn kiểm soát.
$BTC Sunday Night Musings Chia sẻ trước đó trong Báo cáo BTC nhưng các điểm chính: – Weekly OB – Mức cao của tháng 1 – Giá vẽ của HTF FVG – 200MA xếp hàng với sự củng cố trước đó – Hãy xem tâm lý thị trường mở ra như thế nào – Kế hoạch cho cả hai nhưng ủng hộ việc kéo lại Happy Sunday pic.twitter.com/AktQarx8a
— B C Richfield (@BC_Richfield ) Tháng hai 12, 2023
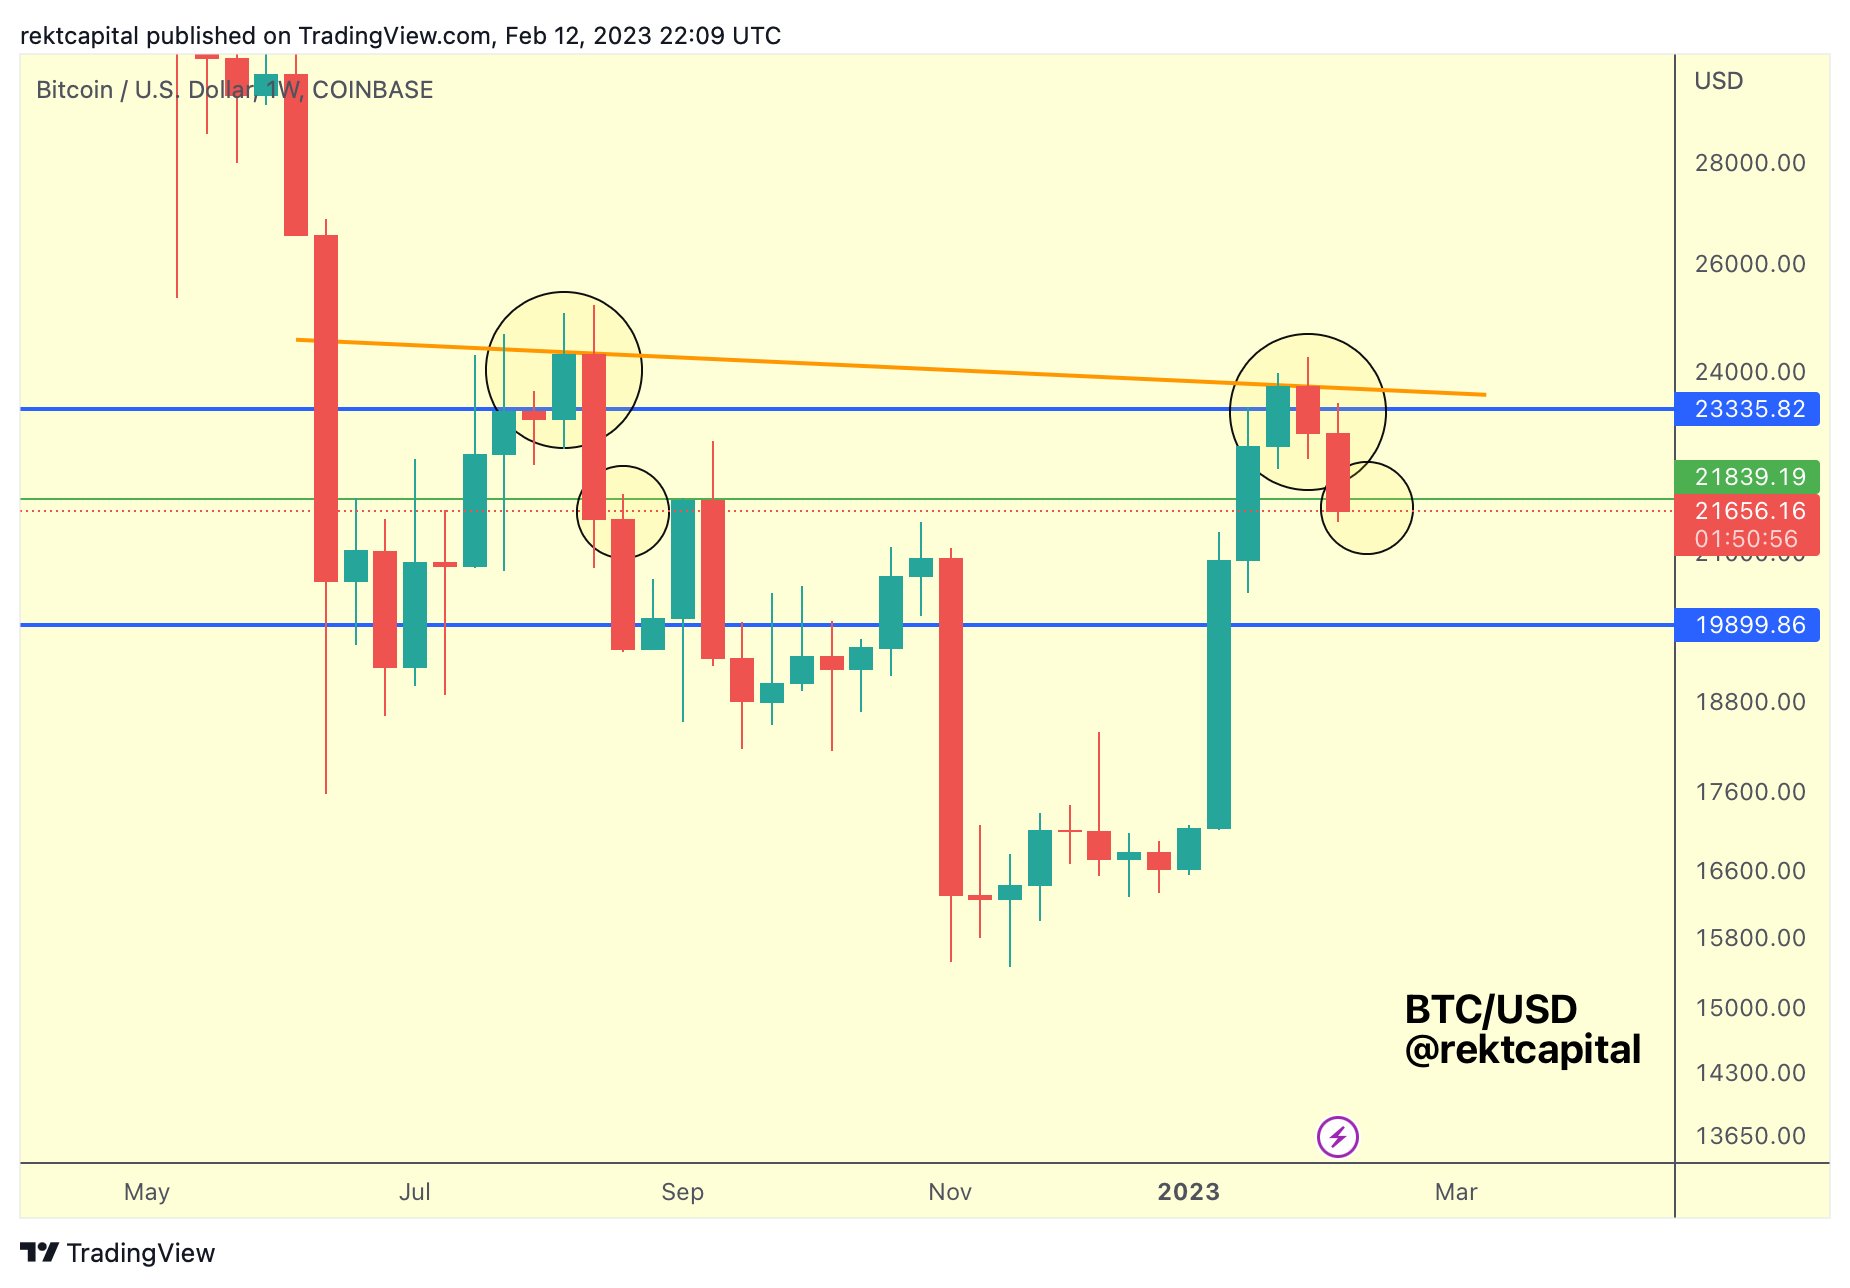
Trên khung thời gian hàng tuần, hình ảnh không tốt hơn, nhà giao dịch và nhà phân tích Rekt Capital cảnh báo. Gắn giá $21,839 là điểm quan tâm, ông nói rằng mức đóng cửa hàng tuần dưới mức này sẽ “xác nhận sự cố” trong BTC/USD, một động thái mà cuối cùng đã trở thành sự thật.
That same level had acted as resistance several times since the middle of last year.
“Most important” CPI print arrives
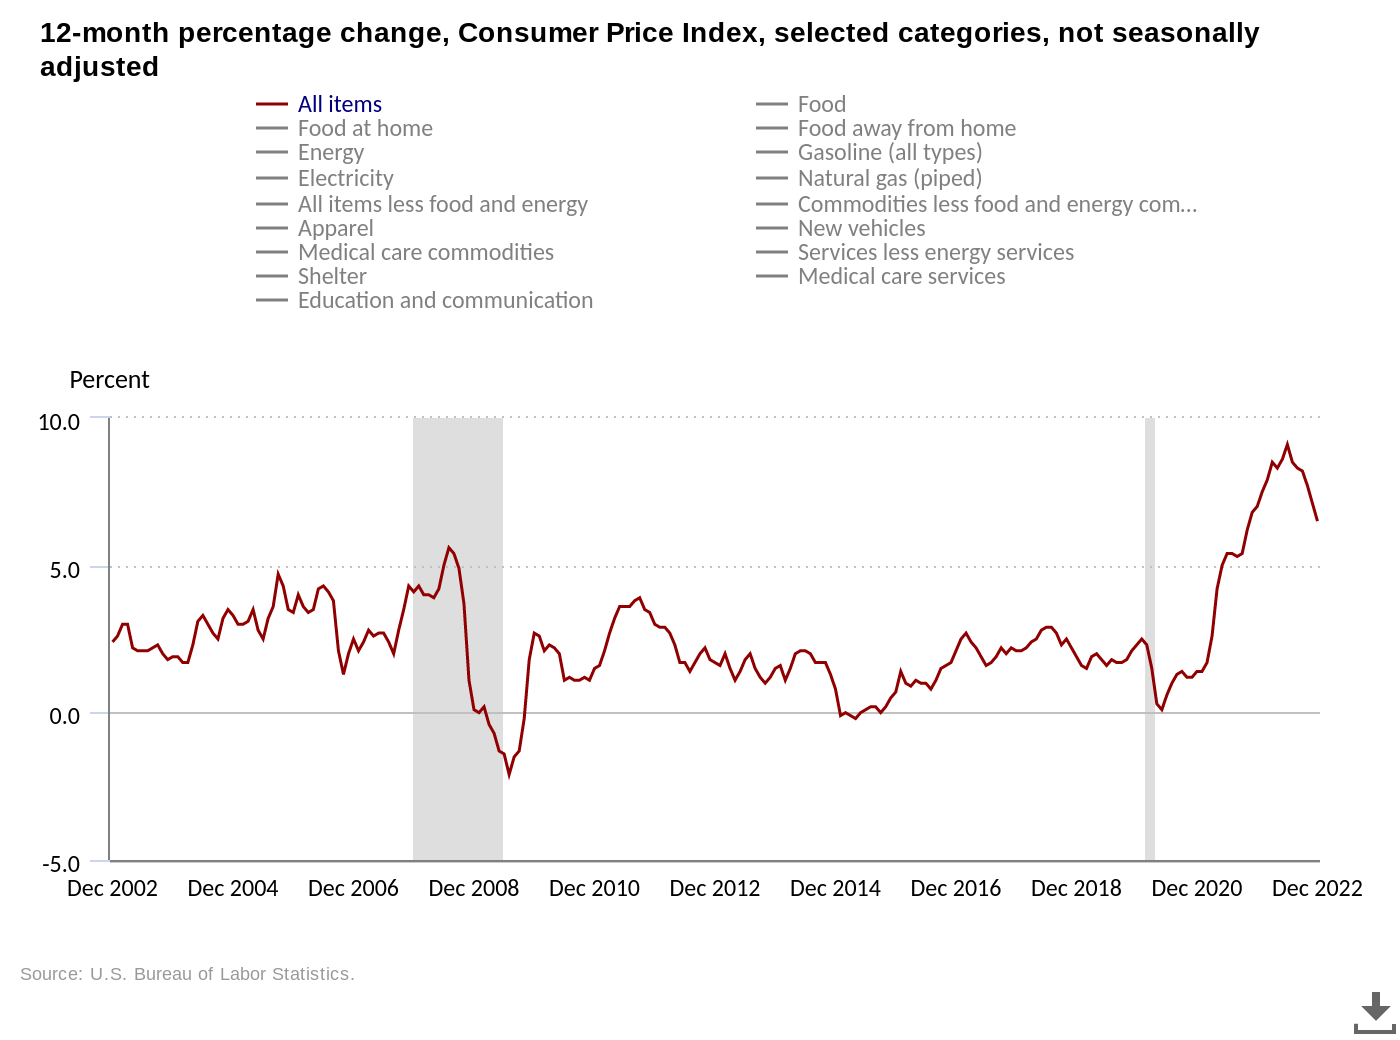
The macro landscape is set to be dominated by one data point in particular this week with the Feb. 14 release of the U.S. Consumer Price Index (CPI) for January.
Bets are on for inflation continuing to decline in a move which could still buoy risk assets despite a comedown in early February.
The picture is complicated by a reshuffling of how CPI is calculated, but analysts dispute its significance versus the overall trend of inflation receding.
Regardless of that, however, this month’s print is being closely eyed far beyond crypto circles.
“Tuesday’s CPI report is the most important report to date. After a strong January jobs report and December CPI ‘revised’ higher, uncertainty is everywhere,” capital markets newsletter, The Kobeissi Letter, told Twitter followers at the weekend.
“Both bulls and bears need the report to go their way. Whichever side is right will drive the market for the next month.”
Popular trader and analyst Myles G meanwhile underscored the consequences for crypto should CPI come in higher than expected, warning that this would “dump the market big.”
“Almost every CPI reveal last 6 months has been an instant dump, then an immediate recovery after traders digested the data,” fellow trader Satoshi Flipper noted about the relationship between CPI and market volatility.
“Will this time be different?”
The extent to which CPI plays a role in policy adjustments at the Federal Reserve is also a topic of debate at present, after Chair Jerome Powell suggested that another metric may be the “most important” tool for inflation monitoring late last year.
With the next decision on interest rates due only in the third week of March, however, policymakers will have the February CPI numbers to hand should January prove an unexpected anomaly.
First-ever weekly “death cross” sparks concern
Bitcoin is caught between two “crosses” this month in a curious scenario, which is dividing opinion when it comes to its significance.
As Cointelegraph reported, a “golden cross” on daily timeframes is combining with a “death cross” on the weekly chart.
The latter is the first of its kind for BTC/USD, but death crosses on other timeframes have often preceded significant price downside.
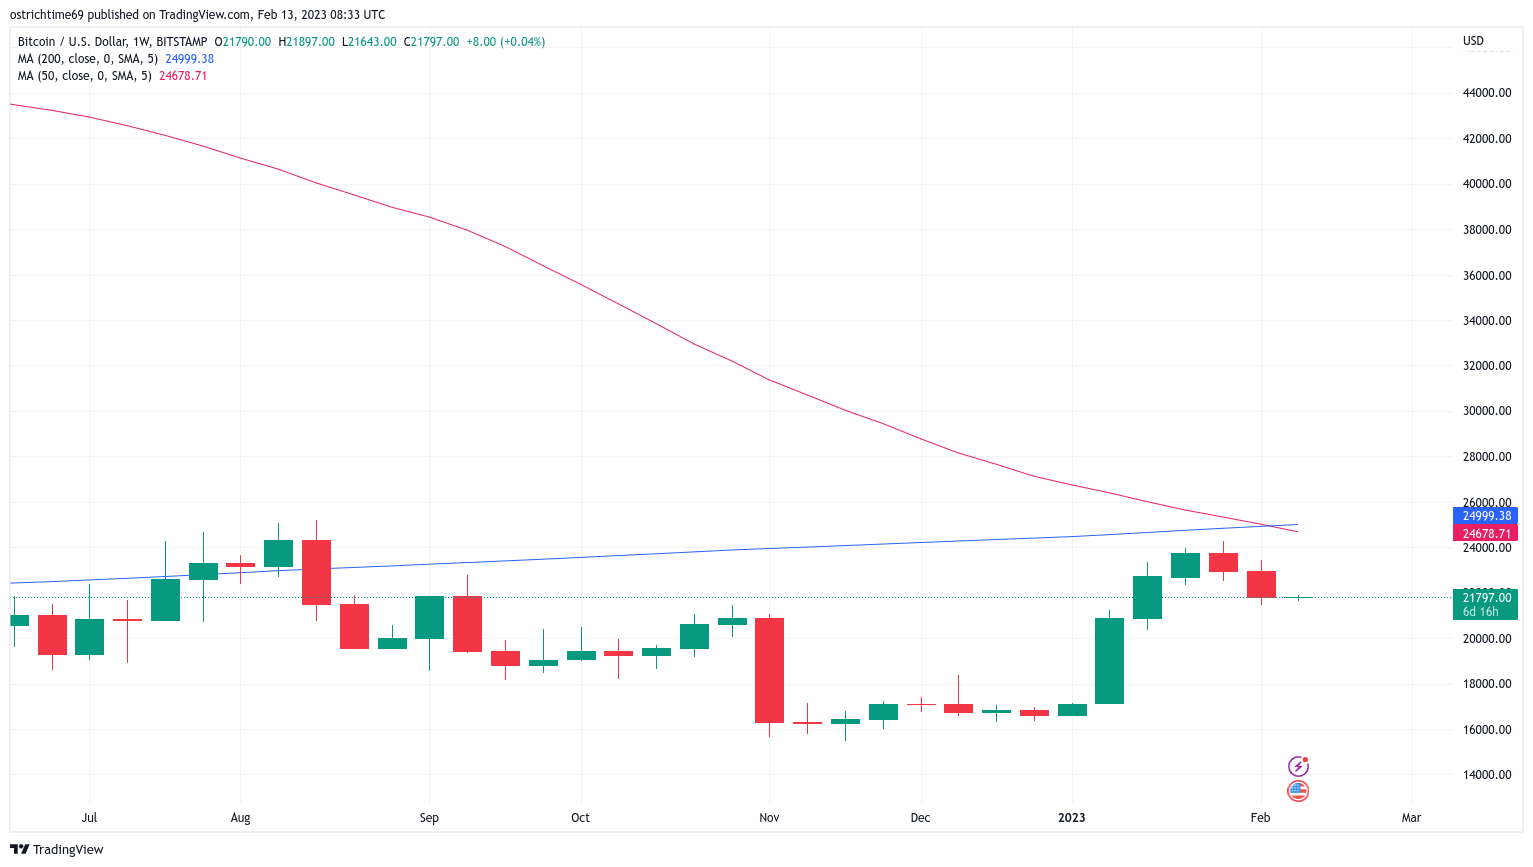
Whether the daily golden cross will repeat historical patterns and buoy the market remains to be seen, but in the meantime, another brand new cross is taking place.
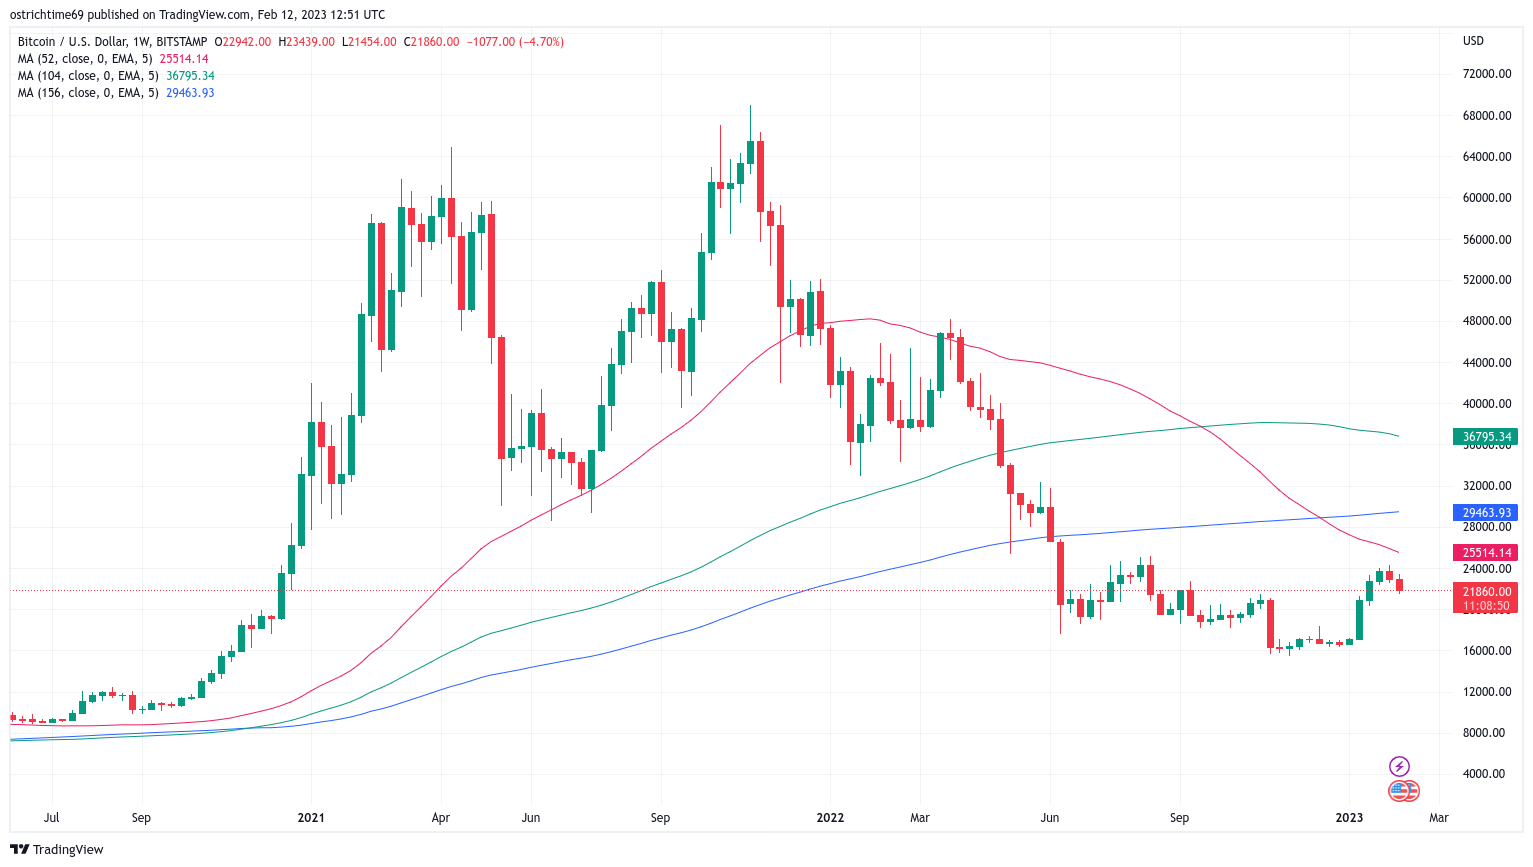
As noted by Caleb Franzen, senior market analyst at Cubic Analytics, Bitcoin’s 1-year exponential moving average (EMA) is about to drop below its 3-year counterpart for the first time ever.
“This crossover has never happened before, highlighting the severity of the BTC bear market,” he wrote in part of Twitter commentary on Feb. 11.
The event in fact occurred in mid-December, but the 1-year EMA has since continued to decline, plunging ever further below the 3-year and 2-year EMAs.
In accompanying analysis, Franzen argued that the crossover could reframe Bitcoin bear market behavior. This time around, the depression could be harder and more drawn out than before.
“While many Bitcoin investors have noted that BTC typically bottoms roughly ~400 days after the bull market peak, this chart suggests that this time is different,” he wrote.
“Considering that we’ve never seen this signal until now, the implication is that the 1-year trend might stay below the 3-year trend even longer!”
He continued that the 2-year EMA may also end up crossing below the 3-year EMA, which would likewise constitute a first-of-its-kind event.
“Personally, I wouldn’t be surprised if that occurs within the next 6 months as a result of further sideways action or downward consolidation,” the analysis forecast.
Whales stay engaged
When it comes to interest in Bitcoin at current prices, whales may have already broken the silence.
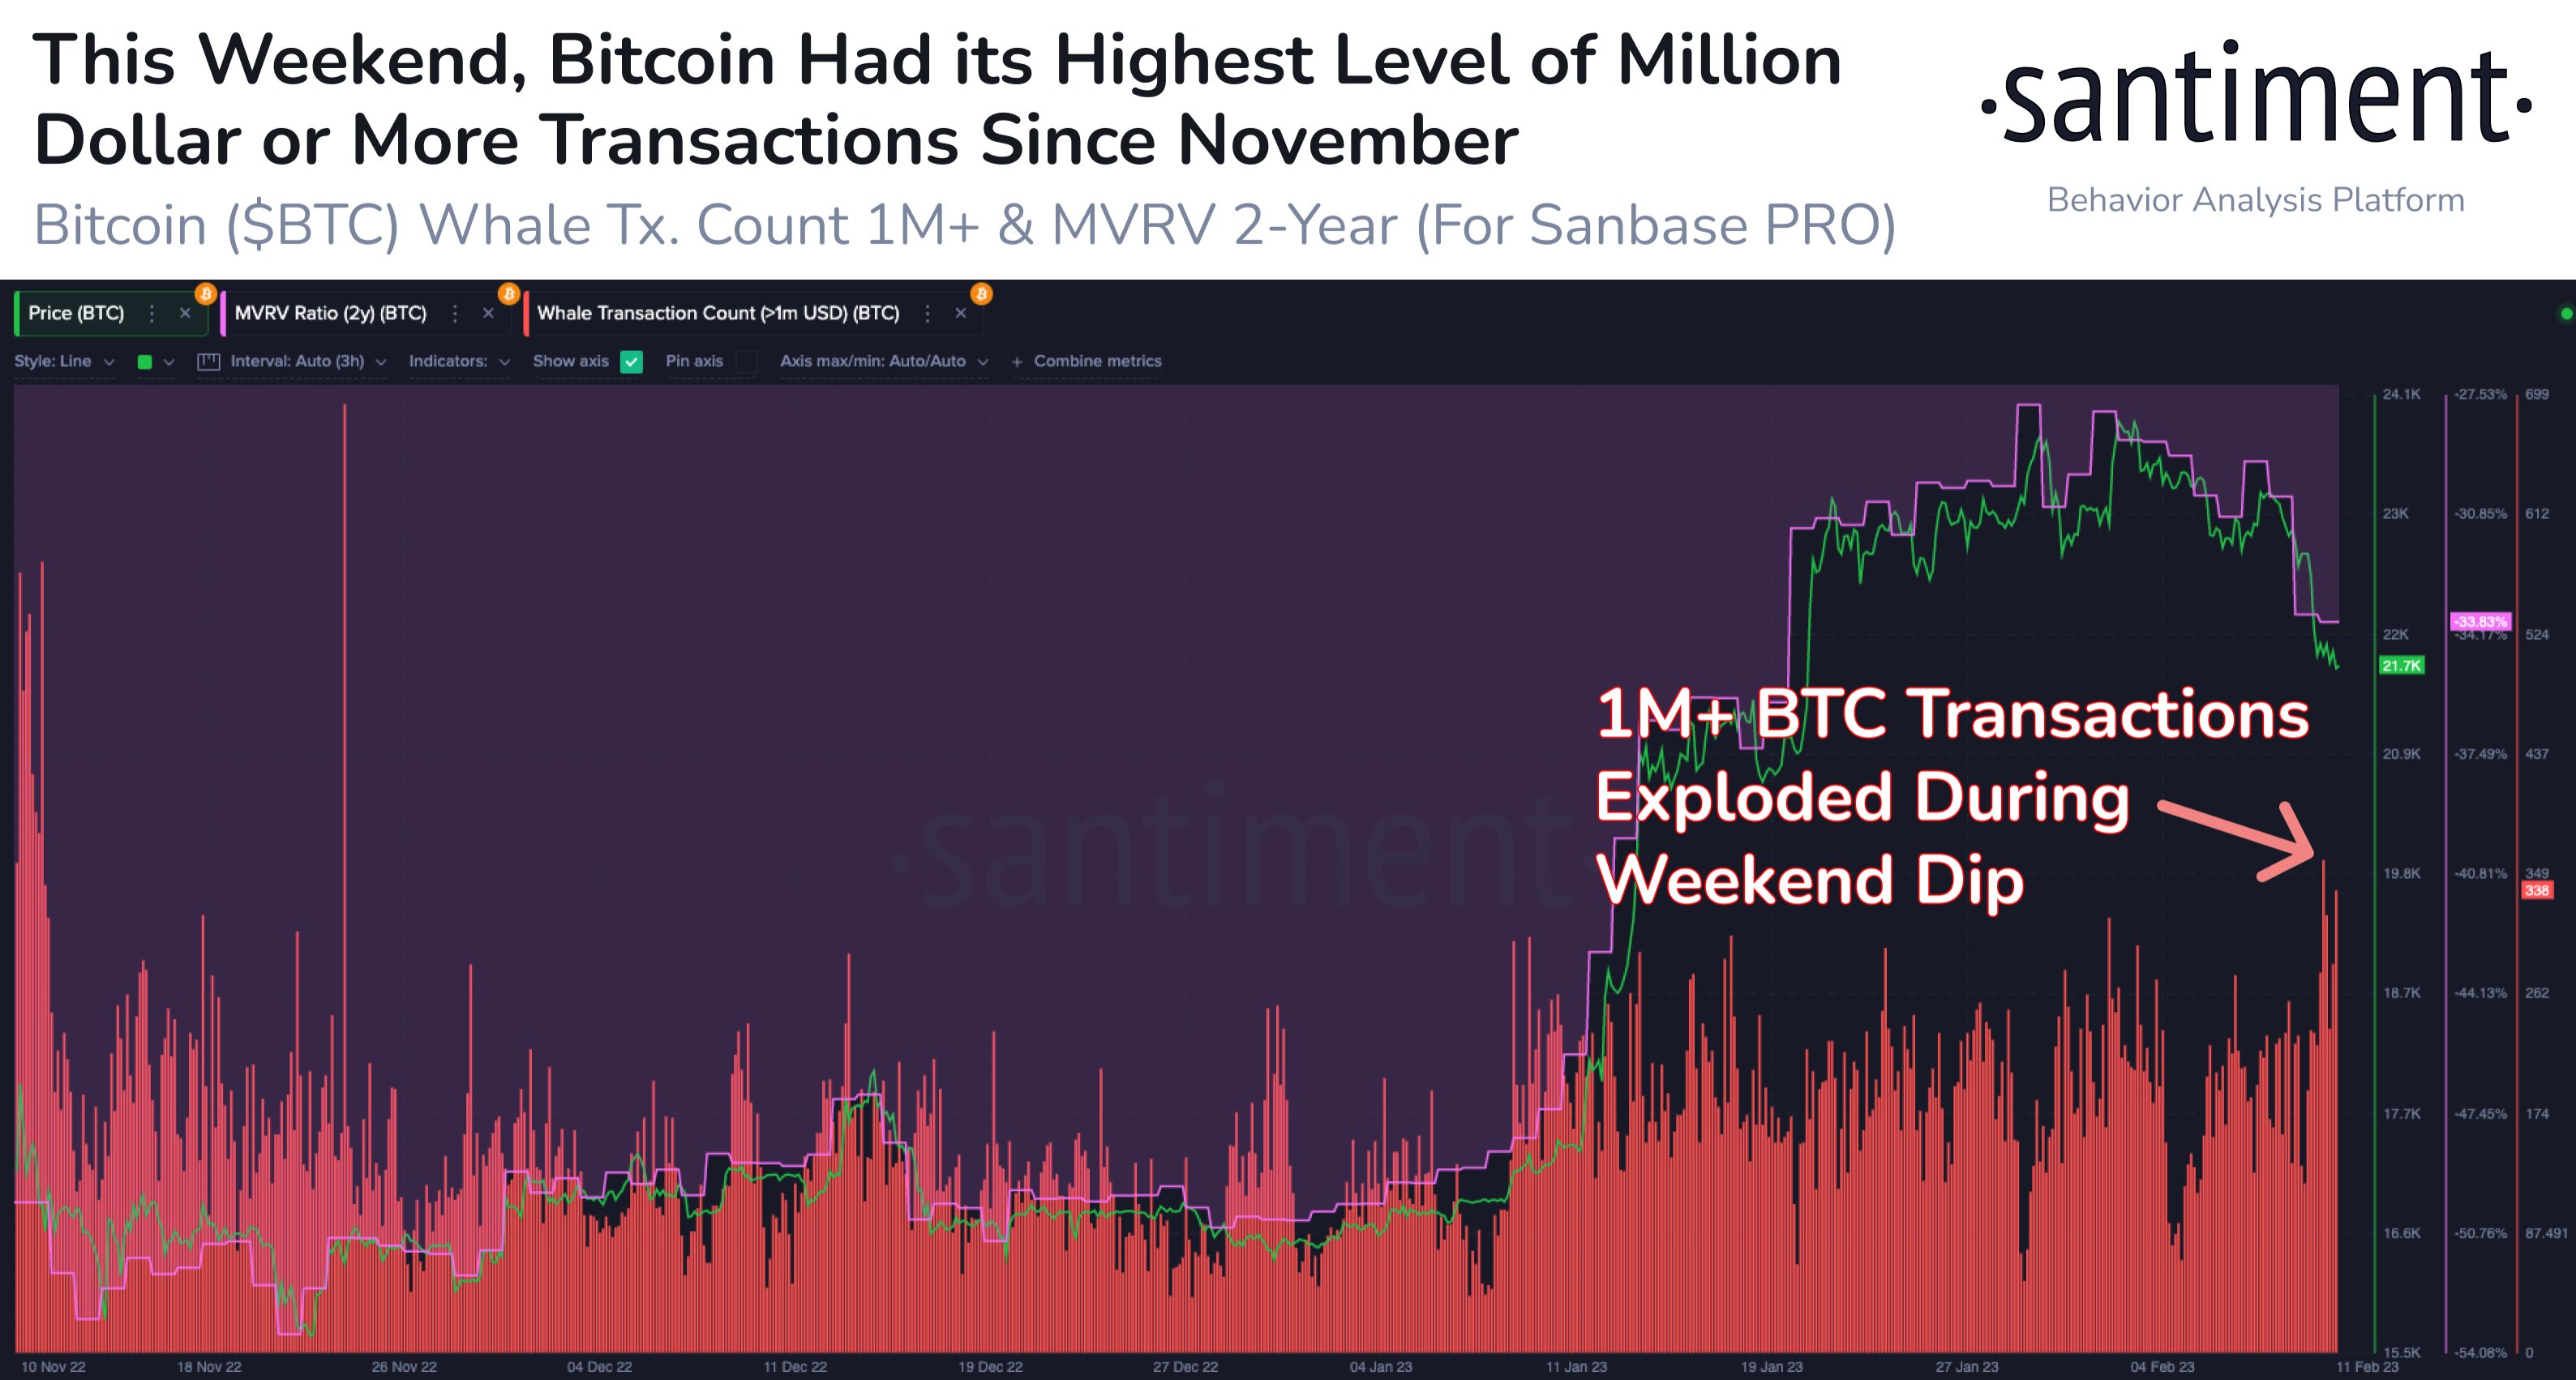
In data released on Feb. 13, research firm Santiment noted that whales had stepped up transaction activity as BTC/USD dipped to $21,600 around the weekly close.
“Bitcoin dipped down to $21.6k on Sunday, and whale addresses responded by transacting at their highest rate in 3 months,” it summarized.
Santiment community contributor sanr_king called the whale moves “significant.”
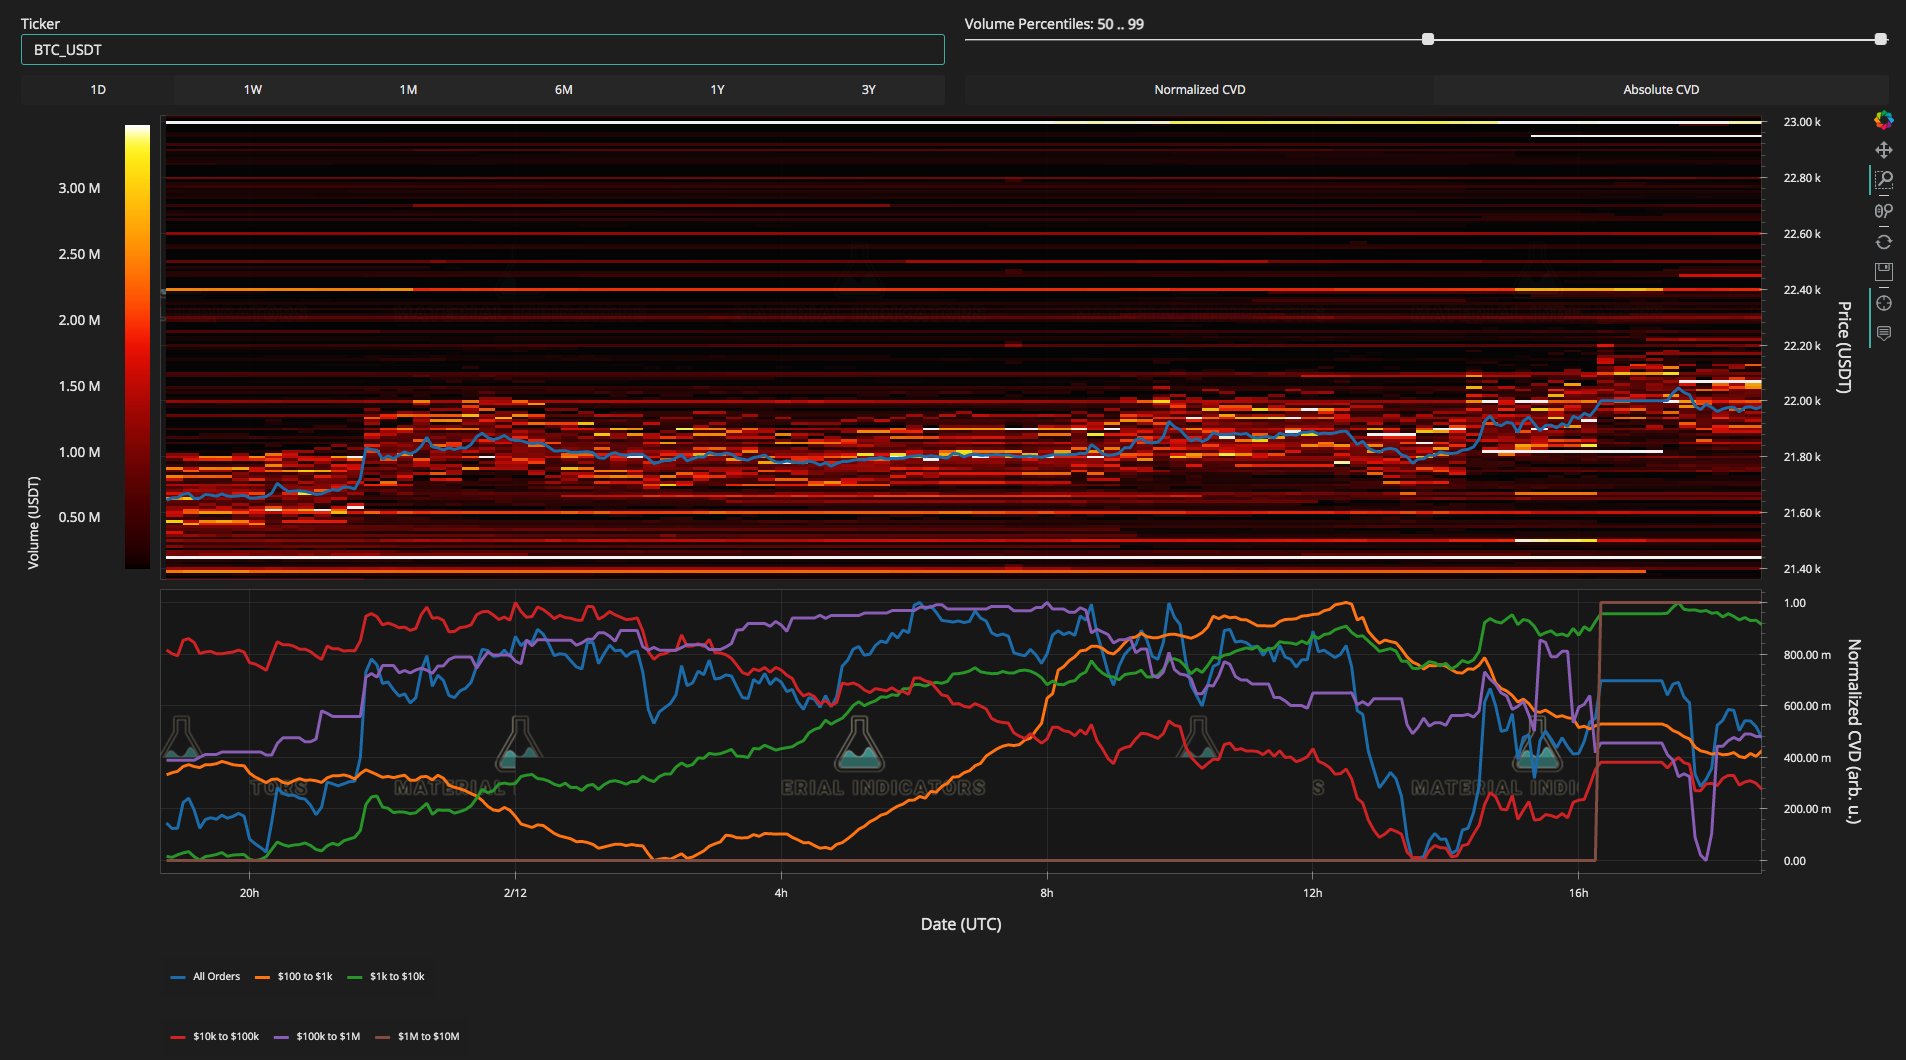
A snapshot of order book activity at Binance meanwhile showed the presence of a major whale entity on Feb. 12, along with a new sell wall at just above $22,000 into the weekly close.
On-chain analytics resource Material Indicators, which uploaded the data, noted it “shows new ask liquidity coincides with resistance at the 21-Day Moving Average and the .618 Fib.”
“Regardless of how high BTC bulls can push before the W close/open, expecting the Death Cross to have an adverse impact on short term upward momentum,” it commented, referencing the aforementioned weekly chart occurrence.
Hodlers bounce back to health
Regardless of what the whales choose to do, the average hodler has yet to take profit, data shows.
Related: Bitcoin is already in its ‘next bull market cycle’ — Pantera Capital
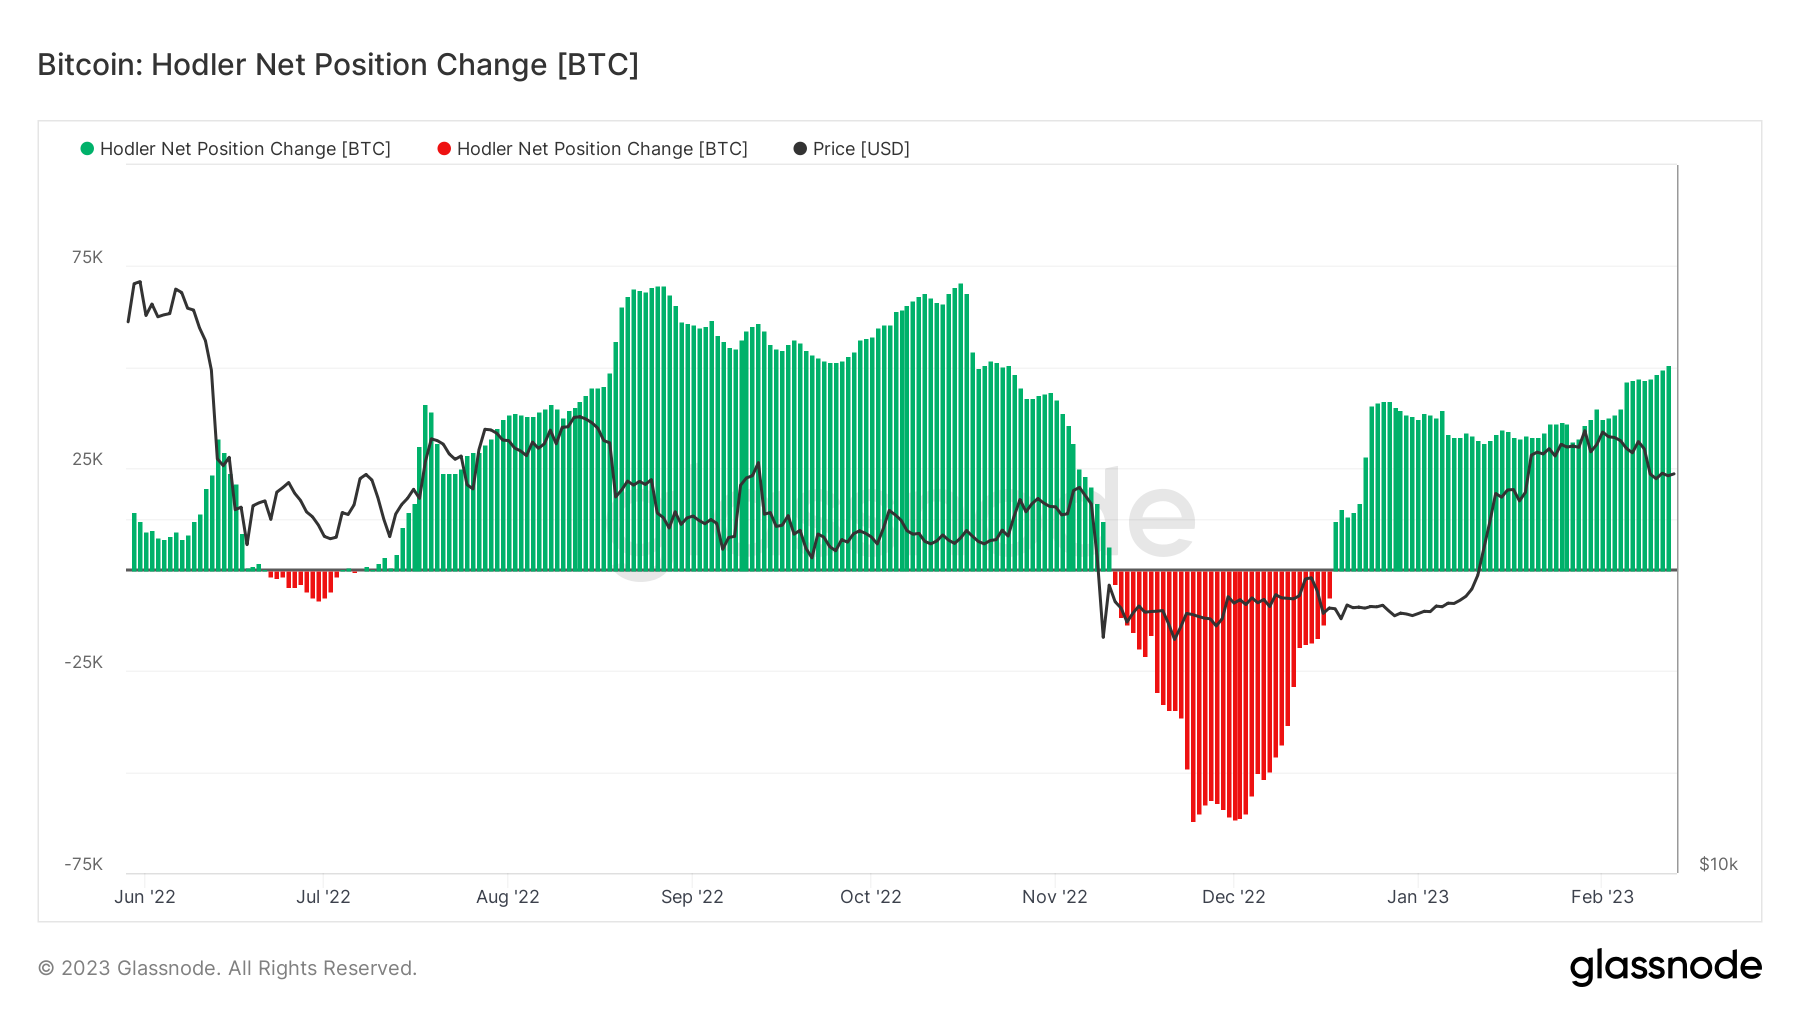
According to on-chain analytics firm Glassnode, long-term holders (LTHs) have been busy accumulating new positions over the past month, in particular.
Its Hodler Net Position Change metric hit three-month highs on Feb. 13, marking a return to hodling behavior not seen since the FTX debacle hit.
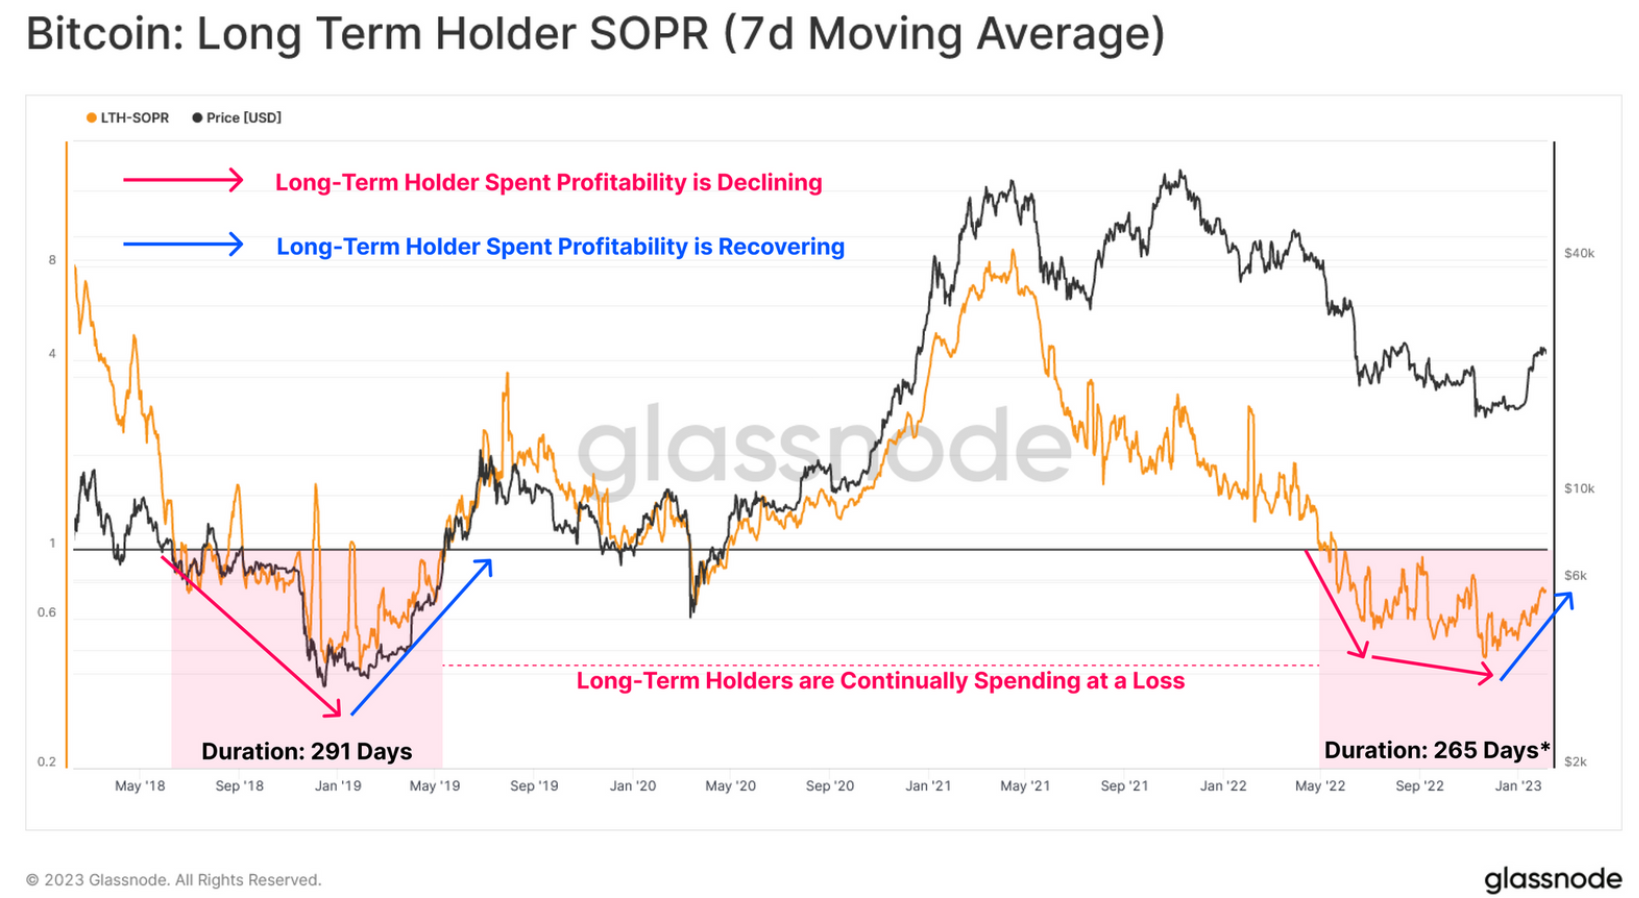
Đối với những LTHS lựa chọn rút tiền ra một số đồng tiền của họ, điều kiện cũng đang được cải thiện. Trong ấn bản trước của bản tin hàng tuần của mình, “The Week On-Chain”, Glassnode mô tả lợi nhuận “phục hồi” vào năm 2023.
It referenced the Spent Output Profit Ratio (SOPR) metric, which measures the relative proportion of in-profit coins appearing in transactions.
“Assessing the Long-Term Holder cohort, we can observe a persistent regime of sustained losses since the LUNA collapse,” it wrote.
“Despite this cohort continuing to take losses over the last 9 months, there are initial signs of a recovery, with a potential uptrend in LTH-SOPR starting to form.”
The views, thoughts and opinions expressed here are the authors’ alone and do not necessarily reflect or represent the views and opinions of Cointelegraph.


