Nền tảng Cointelegraph Markets Pro được tạo ra với mục đích thu hẹp sự phân chia giữa các nhà đầu tư tổ chức và bán lẻ. Các công cụ độc quyền của nó, như chỉ báo Newsquakes™, VORTECS™ Score và chỉ báo Tweet Sentiment, là các phương pháp chính của nền tảng để đạt được mục tiêu này.
Nhìn lại hiệu suất cảnh báo Cointelegraph Markets Pro cho thấy nền tảng cấp tổ chức đã thành công vang dội. Kể từ năm 2021, nền tảng này đã tạo ra lợi nhuận trung bình ít nhất là:
- 2,895% lợi nhuận từ các chiến lược giao dịch dựa trên điểm số (có khả năng biến $10,000 thành $289,549)
- 546% lợi nhuận từ các chiến lược giao dịch dựa trên thời gian (có khả năng biến $10.000 thành $54,635)
851% lợi nhuận từ chiến lược mua và giữ (có khả năng biến $10,000 thành $85,179)
Sau hai năm cung cấp một số cơ hội thương mại chiến thắng mỗi tuần và lắng nghe phản hồi trực tiếp từ hàng ngàn người dùng, nhóm Cointelegraph Markets Pro đã thực hiện các bản cập nhật tính năng được yêu cầu nhiều nhất, cùng với những gì họ biết sẽ cải thiện nền tảng này nhất và đã đưa ra một lặp đi lặp lại mạnh mẽ hơn nữa.
Cointelegraph Markets Pro 2.0 — What’s new?
Bảng điều khiển mới kết hợp các tính năng mới với một cải tiến tổ chức giúp các nhà giao dịch dễ dàng nhận và giải thích thông tin.
Ví dụ, bảng điều khiển hiện được chia thành Xu hướng ngắn hạn và Xu hướng dài hạn, cho phép các nhà giao dịch dễ dàng chuyển đổi giữa các phần tùy thuộc vào sở thích giao dịch của họ.

Dưới đây là bản tóm tắt các tính năng mới có tác động nhất:
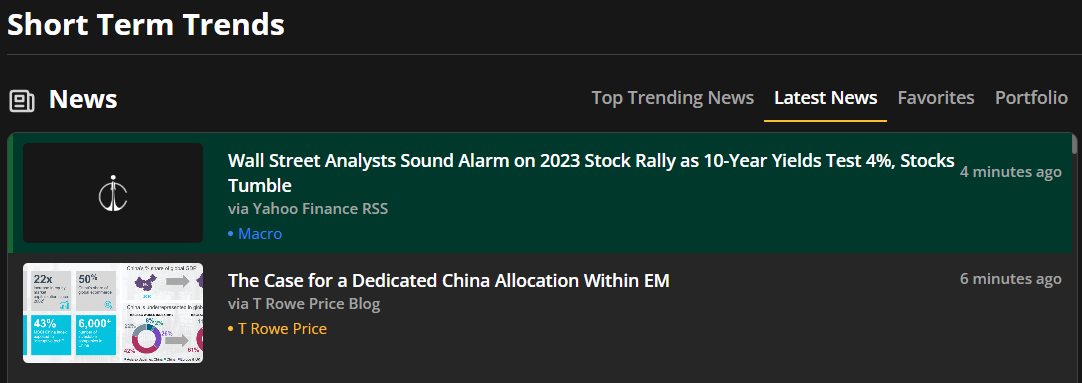
1. An updated news section
The news section now features top trending news and latest news. Top trending news is calculated based on the number of times stories have been tweeted over a 24-hour period. Users can also find the news category in red letters below the title.
2. Top VORTECS™ Scores
The new dashboard provides more detailed information about the tokens with the top VORTECS™ Scores — a numerical value that accounts for an asset’s current sentiment, Twitter activity, trading volume and price movement compared to the entire history of that asset. A higher score suggests current market conditions have historically been more bullish for an asset in a 24-hour window.
3. Top 5 dòng chảy và chảy ra trao đổi
The Top 5 Exchange Outflow section features the assets being removed from an exchange the most frequently over the last hour or 24 hours. If users are removing money from exchanges, it is possible that they are planning to HODL and are less likely to sell.
Ngược lại, phần Top 5 Exchange Inlow có các tài sản được gửi đến một sàn giao dịch thường xuyên nhất trong khoảng thời gian một giờ hoặc 24 giờ. Nếu người dùng đang gửi tài sản đến sàn giao dịch, có thể họ có kế hoạch bán; bán lớn có thể dẫn đến giảm giá.
Ngoài ra, người dùng cũng có thể lọc thông tin này theo blockchain và khung thời gian.
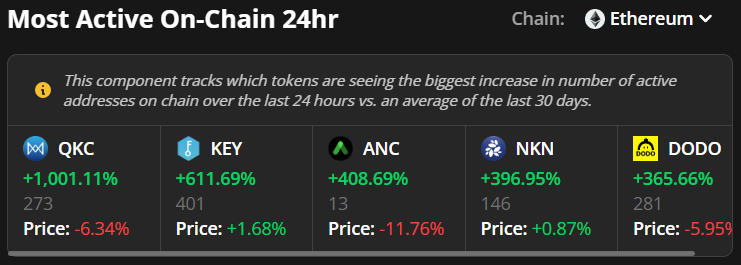
4. Most Active On-Chain 24h

Phần Most Active On-Chain mới cho người dùng thấy năm token với số lượng địa chỉ hoạt động trên chuỗi tăng lớn nhất trong ngày cuối cùng so với mức trung bình lăn của 30 ngày qua.
Like the tweet and trade sections, these tokens are arranged from largest to smallest, left to right. Their price movement is also depicted at the bottom, below the number of addresses. On-chain activity is usually a bullish indication that a project is successfully being used, and users are being onboarded.
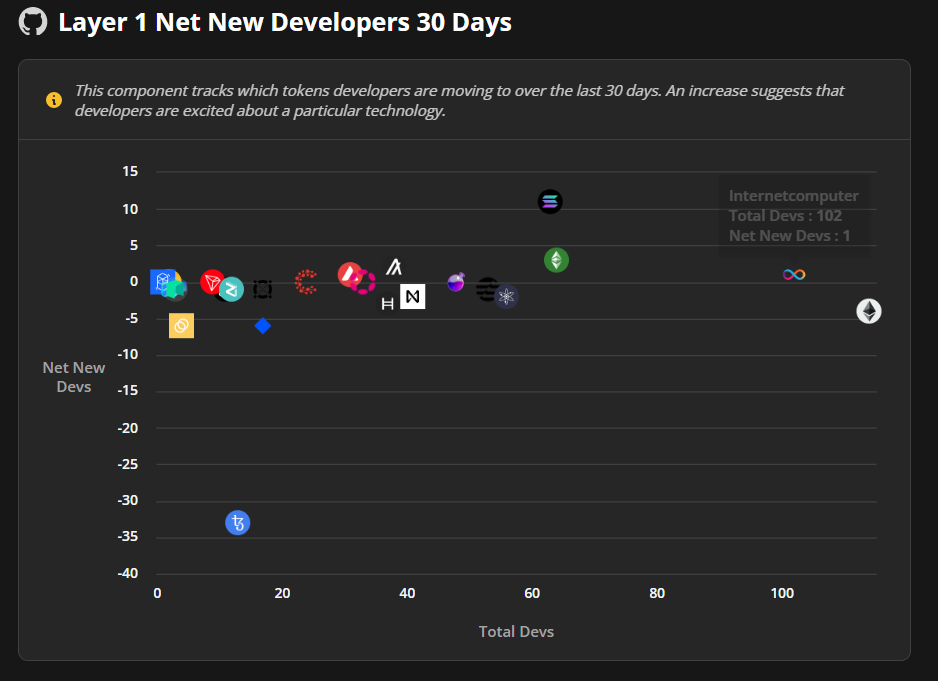
5. Net New Developers by Layer 1 Ecosystem in the last 30 days

This section shows which tokens developers are moving to over the last 30 days. An increase suggests that developers are excited about a particular technology. A layer 1 is only valuable due to the applications built on it, so more development on a layer 1 is a bullish sign long term.
The X-axis shows the total number of developers for the given chain whereas the Y-axis represents the net new developers in the last 30 days.
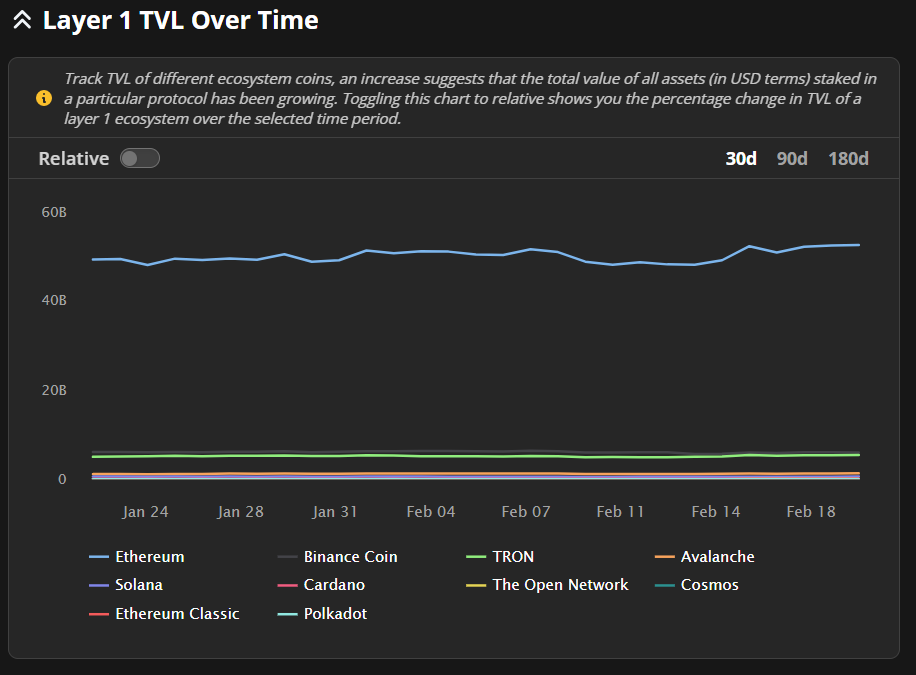
6. Total Value Locked (TVL) Gainers

This chart allows users to track the total value locked (TVL) of different ecosystem tokens. An increase can suggest that the value of all assets staked in a protocol is growing. This is typically bullish as it shows interest and commitment to a particular ecosystem.
Users can also click the “Relative” button to see the percent changes and filter by 30, 90 or 180 days. One can even hide a given blockchain by clicking its name in the drop-down below.
7. Season Indicator

A measure of Cointelegraph Markets Pro data that suggests which of the four asset classes — Cash, Bitcoin (BTC), Ether (ETH) or Altcoins — has historically outperformed each of the other assets in a given season. The season indicator is based on proven data and informs traders which season the market is in right now.
Join the Cointelegraph Markets Pro trading community
The latest update of Cointelegraph Markets Pro has paired institutional-grade tools with a library of information for independent analysis. Pairing individual analysis with the recommendation of institutional tools can help traders constantly locate high-probability winning trades.
The latest enhancements of the Cointelegraph Markets Pro platform are the most powerful yet. For anyone interested in confidently generating strong returns — even in a bear market — Cointelegraph Markets Pro is a platform worthy of consideration.
See how Cointelegraph Markets Pro delivers market-moving data before this information becomes public knowledge.
Cointelegraph Markets Pro is an all-in-one institutional-grade crypto market intelligence platform offering traders of all backgrounds real-time alerts for potential price movements before they occur.
Cointelegraph is a publisher of financial information, not an investment adviser. We do not provide personalized or individualized investment advice. Cryptocurrencies are volatile investments and carry significant risk including the risk of permanent and total loss. Past performance is not indicative of future results. Figures and charts are correct at the time of writing or as otherwise specified. Live-tested strategies are not recommendations. Consult your financial adviser before making financial decisions.
All ROIs quoted are accurate as of February 23, 2023…


