Bitcoin (BTC) bắt đầu tuần trên một nền tảng vững chắc khi bulls đưa giá BTC lên mức cao mới trong mười tháng đóng cửa hàng tuần.
Sau một tuần tương đối bình tĩnh, biến động vào phút chót khiến các nhà giao dịch phấn khích trước triển vọng của một cuộc tấn công lặp lại trên kháng cự $30,000 – nhưng rất nhiều điều cản trở.
Trong tuần công bố dữ liệu kinh tế vĩ mô đáng kể, chỉ số giá tiêu dùng (CPI) tháng Ba sẽ được công bố vào ngày 12 tháng 4, cùng với những hiểu biết mới về chính sách của Cục Dự trữ Liên bang.
Thêm vào đó là nâng cấp Ethereum Shanghai và một công thức cho biến động là có. Bitcoin sẽ phản ứng như thế nào?
Các mối tương quan biến động giữa cryptocurrency lớn nhất và các tài sản rủi ro truyền thống đang đảo ngược, dữ liệu cho thấy, trong khi dữ liệu tâm lý cũng cho thấy rằng có rất ít sự thèm ăn cho việc bán đột ngột trong số các cơ sở hodler.
Cointelegraph có một cái nhìn vào hiện trạng trong giai đoạn bắt đầu với những gì hứa hẹn sẽ là một tuần mà giữ cho những người tham gia thị trường trên ngón chân của họ.
Tiêu đề CPI chính tuần dữ liệu vĩ mô
Một sự kiện quen thuộc dẫn đầu lịch vĩ mô trong tuần, với dữ liệu Chỉ số giá tiêu dùng (CPI) của Hoa Kỳ sẽ được công bố vào tháng Ba.
Việc phát hành, lần này vào ngày 12 tháng 4, theo truyền thống đi kèm với sự biến động cao trong tài sản rủi ro, làm cho ngày đó trở thành một khu vực quan trọng để theo dõi “giả mạo” trên thị trường tiền điện tử.
Cục Dự trữ Liên bang sẽ tiếp tục đưa ra biên bản cuộc họp của Ủy ban Thị trường Mở Liên bang (FOMC) mới nhất, trong đó họ chọn tiếp tục tăng lãi suất.
Key Events This Week:
1. March CPI inflation data on Wednesday
2. Fed minutes on Wednesday
3. March PPI inflation data on Thursday
4. Consumer sentiment data on Friday
5. Retail sales data on Friday
6. 4 Fed speakers this week
This week determines what the Fed does next.
— The Kobeissi Letter (@KobeissiLetter) April 9, 2023
Môi trường do đó hơi phức tạp khi nói đến CPI tác động đến hiệu suất tài sản. Trong khi các nhà giao dịch muốn thấy lạm phát giảm nhanh hơn dự kiến, bản thân Fed vẫn là diều hâu, tháng trước xác nhận rằng tăng lãi suất hơn nữa có thể là thích hợp.
Tuy nhiên, sự phân kỳ giữa Fed và thị trường là bằng chứng như nhau – tâm lý đã bắt đầu cho thấy rằng sau này chỉ đơn giản là không tin rằng tăng lãi suất sẽ tiếp tục lâu hơn nữa.
Theo Công cụ FedWatch của CME Group, cuộc họp FOMC tháng tới có thể sẽ kết thúc với mức tăng 0.25% lặp lại. Những tỷ lệ cược này rất linh hoạt, và phản ứng ngay lập tức với bất kỳ bản phát hành dữ liệu vĩ mô mới, bao gồm CPI.

Đối với nhà phân tích kinh tế vĩ mô và thị trường chứng khoán James Choi, có một khía cạnh khác của câu chuyện lạm phát, một trong những liên quan đến một cơn gió ngược truyền thống cho tiền điện tử: đồng đô la Mỹ.
Phát hành tuần này sẽ thiết lập sức mạnh của đồng đô la trên một giải phóng tự do ba tháng, ông cảnh báo vào ngày 10 tháng 4, mở đường cho một số khả năng giảm thêm tiềm năng đối với tài sản rủi ro.
“People seem to have no idea how the $USD $DXY will fall in the next 3 months,” he commented on a U.S. dollar index (DXY) chart originally shared in late 2022.
“Và vụ thảm sát này sẽ bắt đầu với báo cáo CPI tuần này. Hãy đánh dấu lời của tôi, đánh dấu chúng tốt…”

Những người khác đang chú ý đến thu nhập ngân hàng Q1 như một nguồn tiềm năng phản ứng thị trường giật đầu gối, trong đó có Jim Bianco, chủ tịch của công ty phân tích vĩ mô, Bianco Research.
In part of Twitter commentary, Bianco predicted that the earnings would be “bigger than CPI.”
Bitcoin price volatility on the up
If volatility is what traders want, they arguably already have it in abundance, data shows.
According to market data resource Kaiko, Bitcoin is on a diverging path from equities when it comes to volatility, increasing action while the Nasdaq cools.
The events of last month, centered around the unfolding U.S. banking crisis, were enough to send the “gap” between Bitcoin and Nasdaq 30-day rolling volatility to its highest levels in a year.

Bitcoin’s correlation with gold, Kaiko revealed last week, is now higher than that with the S&P 500.

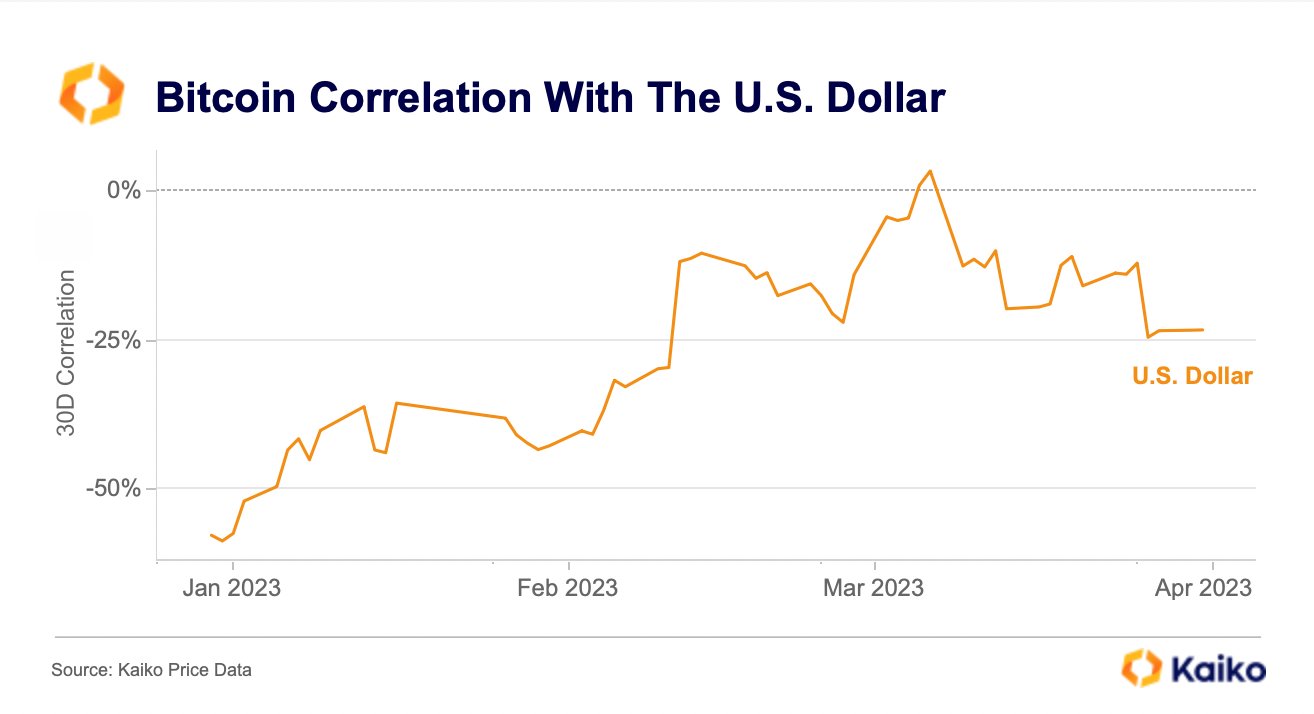
Continuing, Kaiko noted that Bitcoin’s inverse correlation to the U.S. dollar is also rapidly unwinding.
“Although BTC remains negatively correlated with the US Dollar, the correlation is now almost negligible, falling from -60% to -23% YTD,” part of Twitter commentary read at the weekend.
BTC price sets new 10-month high weekly close
Bitcoin offered a late surprise into the April 9 weekly close, with BTC/USD making last-minute gains to seal the candle at just above $28,300 on Bitstamp, data from Cointelegraph Markets Pro and TradingView shows.
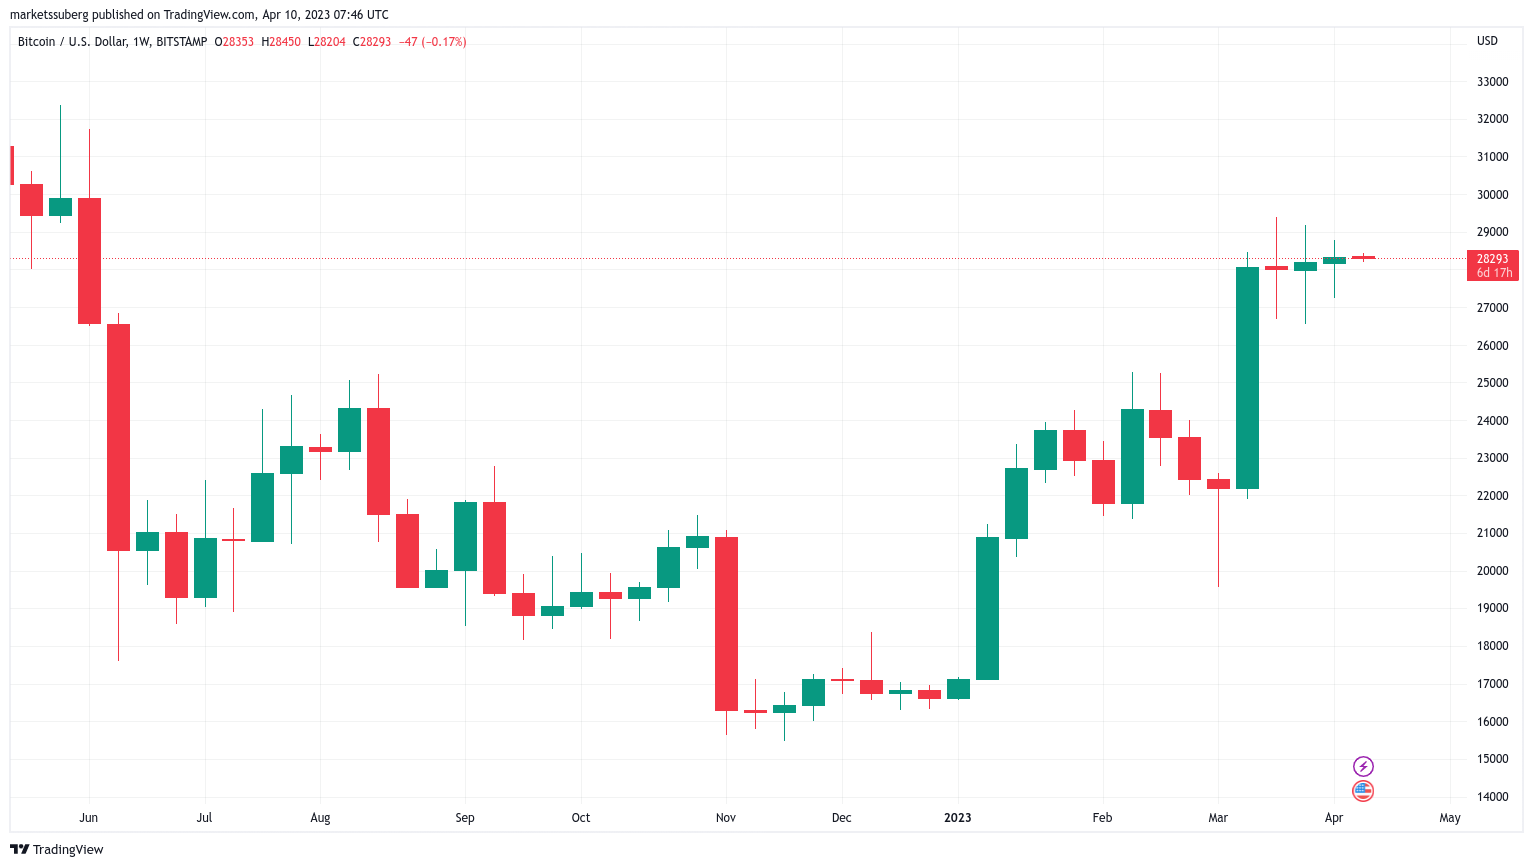
This is impressive in itself, marking fresh ten-month highs for weekly closes as bears are continually denied a return to lower levels.
“Bitcoin still holding the lower area of support, and still following the path,” Michaël van de Poppe, founder and CEO of trading firm Eight, wrote as part of his latest analysis.
“Everyone wants to long $25K, but I think we won’t be getting it. No clear bearish divergences either on higher timeframes. Retest of $28.6K & most likely breakout to $30K+.”
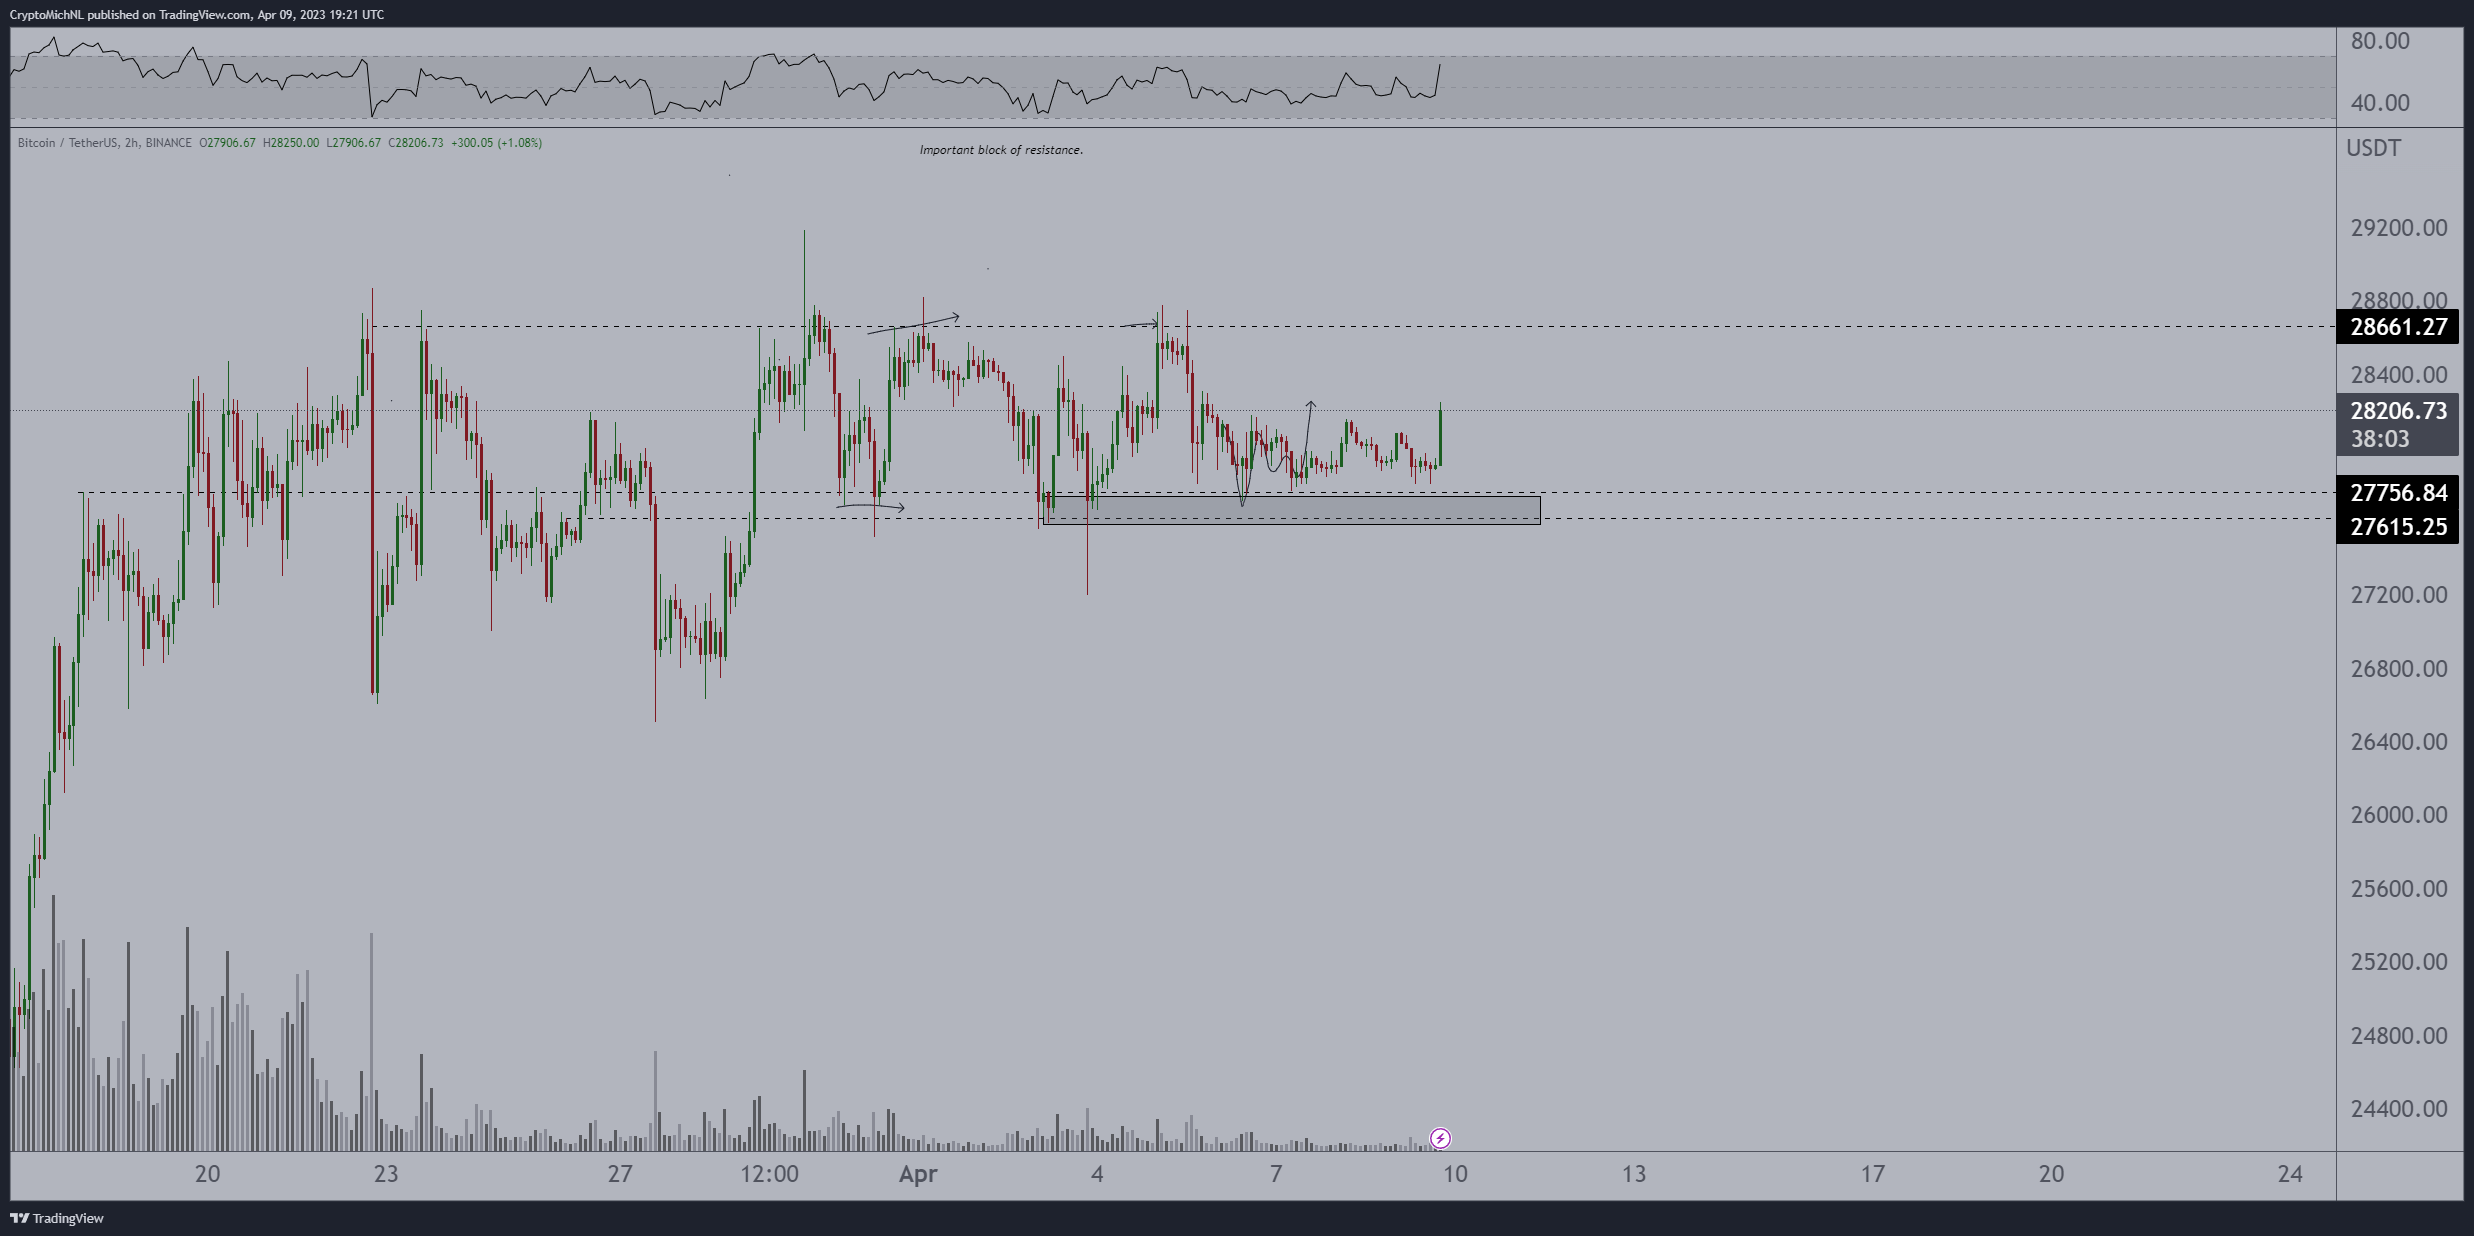
During the close, BTC/USD managed to hit local highs of $28,540 before returning to consolidate below the closing level.
Van de Poppe remains optimistic about the short-term prospects.
“Bitcoin consolidated at support and runs to $28,500. Another test of $28,600-29,000 and we’ll most likely breakout significantly,” he continued.
“More importantly; confidence comes back in the markets then, so you’ll see more Altcoins starting to break out.”
Related: Crypto winter can take a toll on hodlers’ mental health
In his own appraisal of longer-term market strength, popular trader and analyst Rekt Capital described Bitcoin as “very well positioned” to make further gains.
#BTC is very well-positioned for mid- to long-term upside
It would be a shame to miss out on the exponential post $BTC Halving gains#Crypto #Bitcoin pic.twitter.com/FE1j3nCTmN
— Rekt Capital (@rektcapital) April 9, 2023
When it comes to price action in 2023 so far, however, he remains conservative, noting the ongoing potential for BTC/USD to form a “double top” structure and return towards its yearly open.
“Still unclear whether BTC is forming a Double Top here,” he summarized alongside an explanatory daily chart.
“Either side of the Double Top formation is approximately equal, though this more recent part is becoming a bit longer. If this second part becomes even longer, it could distort the pattern altogether.”

Ethereum Shanghai upgrade looms
As Bitcoin market dominance sees a return to form, BTC may see an internal source of friction this week as Ethereum (ETH) prepares to undergo its Shanghai hard fork.
Cointelegraph has extensively reported on the event, which will unlock — and open up for sale — around $2 billion in ETH.
Analysts are classically divided over how intense the resulting sell-side pressure might be, with some more sober takes arguing that there will be few incentives for holders to exit the market.
“For those looking to ‘sell the news’ after the Shanghai upgrade, staked ETH will take around 1 year+ to be completely unlocked, it will be on a first come first served basis,” analytics account The Modern Investor summarized on Twitter.
“Those who started in 2021 will be released first. Caution: You’ll just be selling your ETH to whales.”
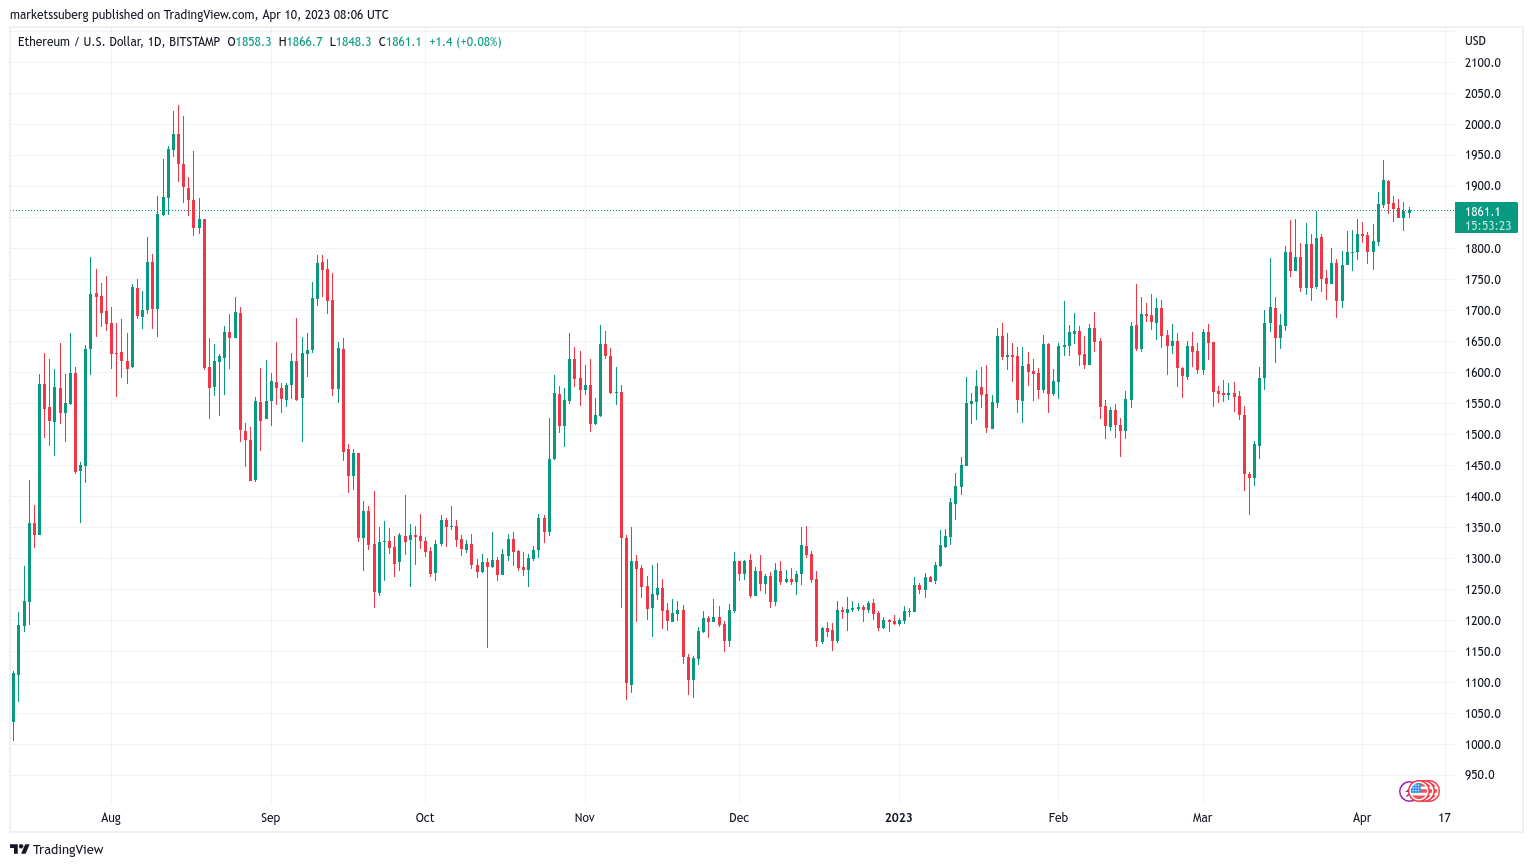
While ETH/USD recently hit its highest levels since August, attempting to snatch $2,000, ETH/BTC is struggling to lift off from ten-month lows.

“Rejected,” popular trader Cheds reacted to the latest events on the ETH/BTC daily chart.
Sustainable greed?
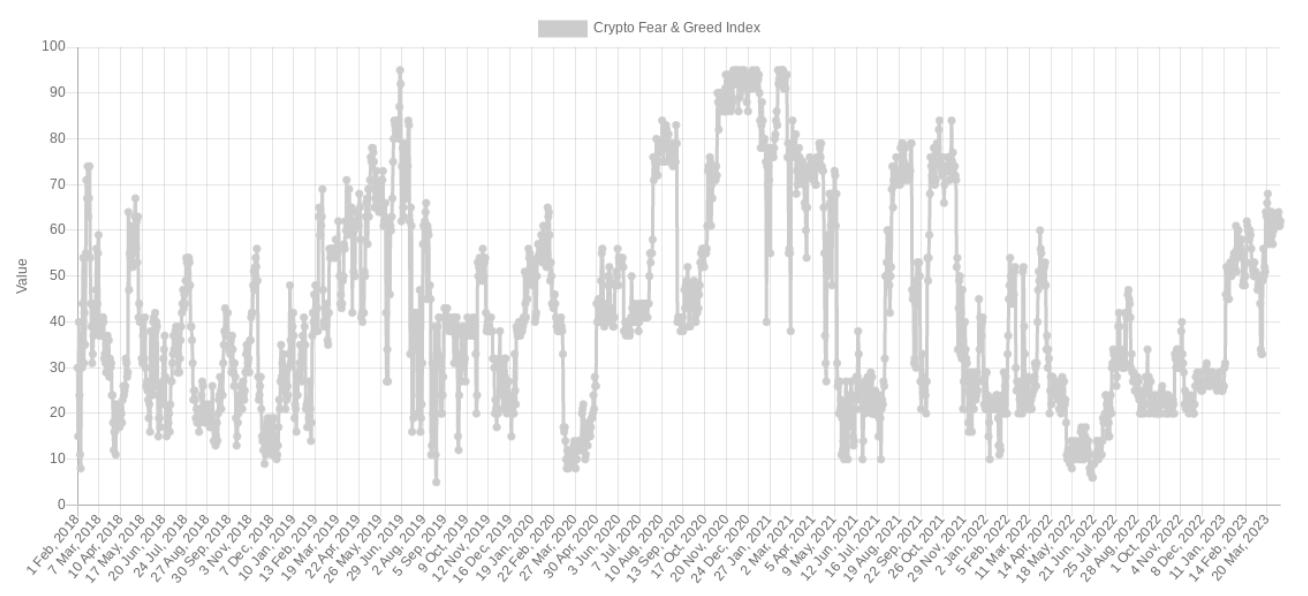
Despite crypto market sentiment being at its most “greedy” since the BTC/USD all-time highs of November 2021, there are some encouraging signals from hodlers.
Related: Bitcoin traders expect ‘big move’ next as BTC price flatlines at $28K
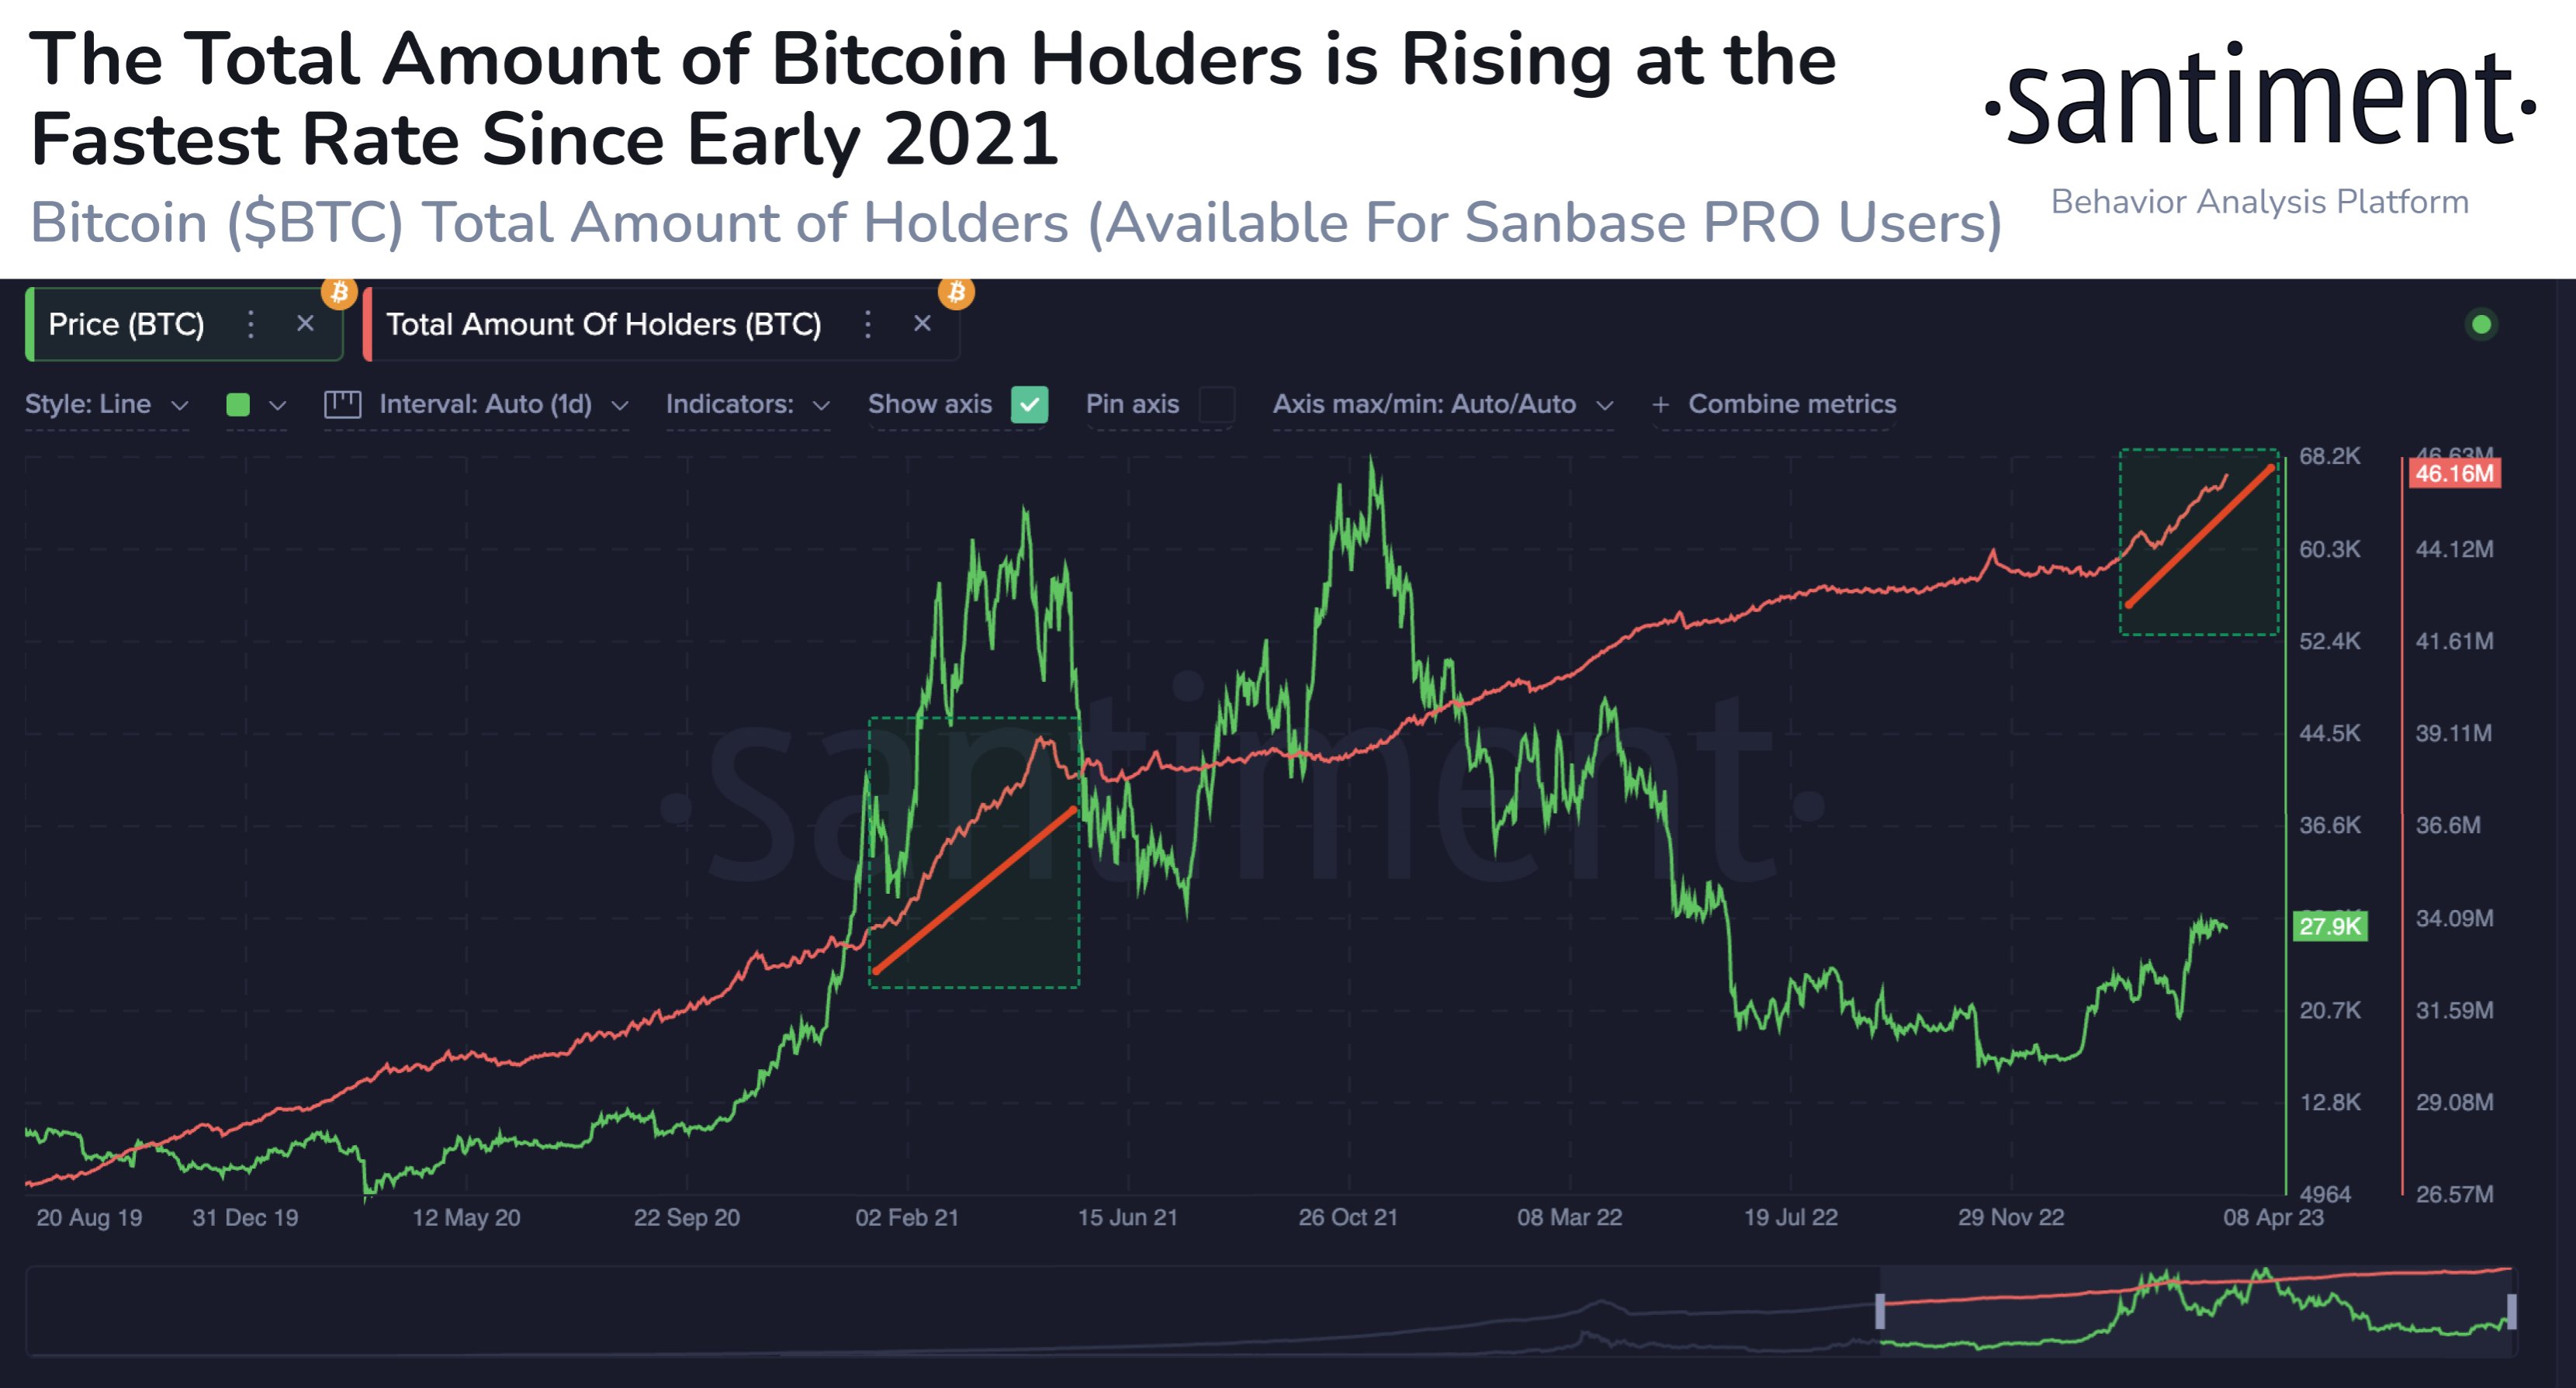
These come courtesy of research firm Santiment, which at the weekend noted an ongoing trend, which echoes hodler action from earlier that year as Bitcoin headed into unknown price territory.
“There is a rising rate of Bitcoin hodlers as traders seem to have become increasingly content in keeping their bags unmoved for the long-term,” it stated.
“We saw a similar trend from January, 2021 through April, 2021 when $BTC rose above $64k for the first time.”
During Q1 2021, crypto market “greed” was much more intense, with the Crypto Fear & Greed Index spending much of the time near its maximum levels — traditionally a warning that a correction is due.
The views, thoughts and opinions expressed here are the authors’ alone and do not necessarily reflect or represent the views and opinions of Cointelegraph.


