Bitcoin (BTC) bắt đầu một tuần mới trong một tâm trạng hoàn toàn khác khi đóng cửa nến hàng tuần mang lại một động thái cao hơn.
Tiền điện tử lớn nhất, vẫn bị mắc kẹt trong một phạm vi hẹp, cuối cùng cho thấy dấu hiệu của sự sống sau vài lần tăng lên mức thấp nhất trong hai tháng.
Với sự biến động trở lại, các nhà giao dịch vẫn còn mâu thuẫn – liệu sức mạnh khung thời gian ngắn có thể dẫn đến sự phá vỡ xu hướng tổng thể?
Ý kiến khác nhau khi tháng sắp kết thúc, và mang đến một cuộc thách kinh tế vĩ mô, mà đã làm cho chính nó cảm thấy — thỏa thuận trần nợ của Hoa Kỳ.
Với một thỏa thuận nâng trần và tránh một mặc định của chính phủ Mỹ gần như ở đây, tài sản rủi ro có thể được giảm trên toàn bộ bảng. Kể từ khi thị trường chứng khoán đóng cửa cho đến ngày 30 tháng 5, tuy nhiên, nó sẽ là một trò chơi của “chờ và xem” cho các nhà giao dịch Bitcoin để bắt đầu tuần.
Bản thân Bitcoin, tất nhiên, luôn luôn mở, và trần nợ dường như đã hình thành một động lực cho sự lạc quan mặc dù đại diện cho ít về xu hướng chính sách kinh tế vĩ mô.
Với điều đó, cuộc trò chuyện trong mật mã là tất cả về những gì sẽ xảy ra tiếp theo.
Cointelegraph xem xét những điều này và một số yếu tố quan trọng khác cần xem xét khi nói đến hành động giá BTC trong những ngày tới.
Nợ trần thỏa thuận gần Quốc hội
Sau vài tuần kịch tính, chính quyền Biden đã hình thành và trình bày một giải pháp cho thất bại trần nợ của Mỹ và trình lên Quốc hội.
Trong khi vẫn chưa biết liệu nó sẽ vượt qua, cược đã đi trước kết quả.
“Tôi nghĩ rằng hầu như chắc chắn rằng nó sẽ được thông qua,” Jeremy Siegel, giáo sư tài chính tại Đại học Pennsylvania, nói với CNBC, tóm tắt một lý thuyết phổ biến.
Một kịch bản diệt vong thực sự, những người khác đã chỉ ra, là khó xảy ra, vì thỏa thuận trì hoãn tại thời điểm này không ngay lập tức mở ra Mỹ để một kịch bản mặc định.
“Tuần tới vẫn sẽ mang lại sự không chắc chắn về trần nợ khi thỏa thuận này thông qua Quốc hội”, công ty thương mại Mosaic Asset tiếp tục trong ấn bản mới nhất của loạt bản tin, “The Market Mosaic”.
“Chúng tôi cũng sẽ nhận được báo cáo cập nhật từ ISM về hoạt động của ngành sản xuất, cộng với báo cáo việc làm tháng Năm. Bất kể những tiêu đề đó, tôi đang theo dõi hành động trong các cổ phiếu trung bình và các lĩnh vực chu kỳ chặt chẽ nhất
Tin tức về bản thân thỏa thuận, trong khi đó, đã làm việc kỳ diệu ngay lập tức trên một BTC/USD mờ nhạt, trong đó chứng kiến một số biến động cổ điển cuối tuần để đạt $28,450 qua đêm.
Hiện tại giao dịch ở mức thấp hơn $28,000, cặp này đã cải thiện triển vọng của nó, ngay cả khi nó liên quan đến xu hướng trong tuần.
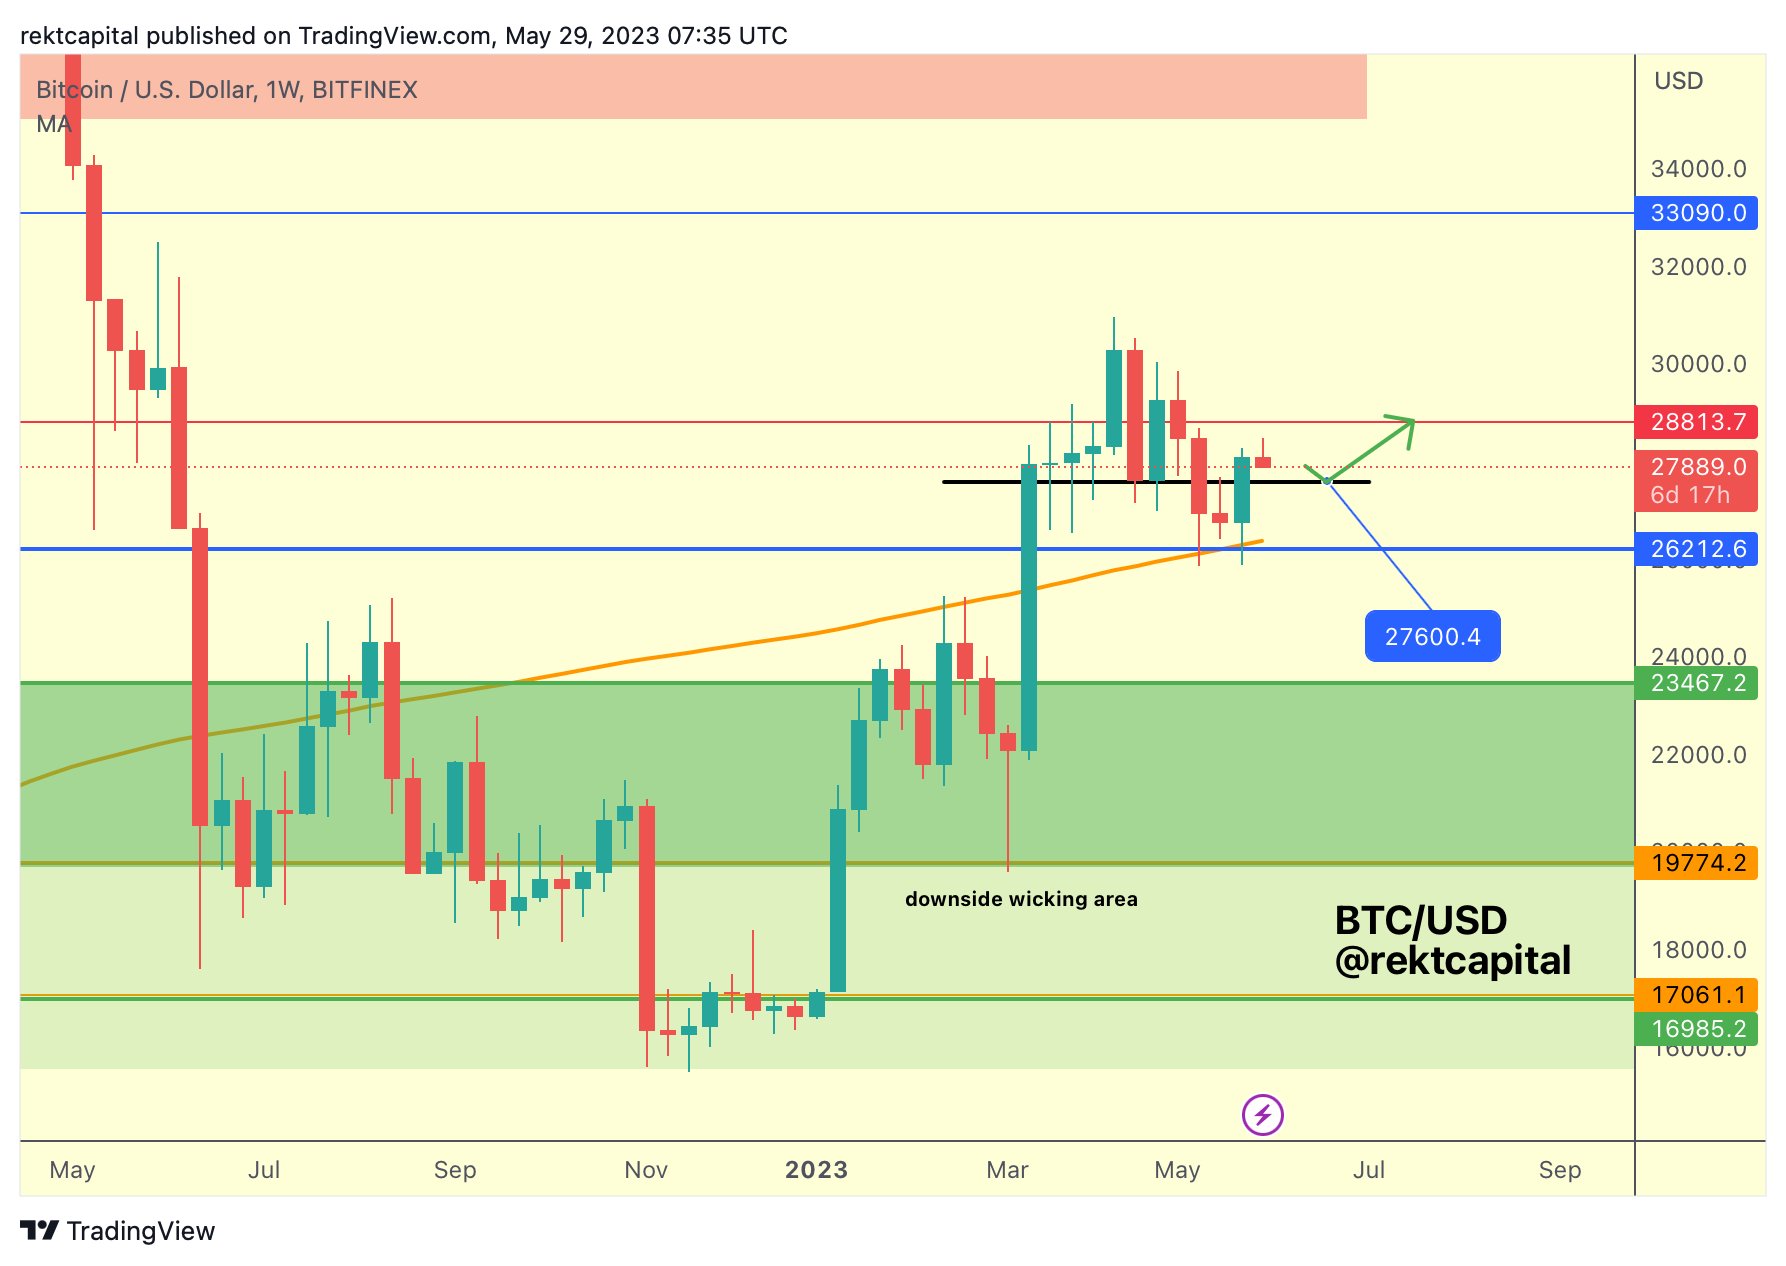
“Bây giờ đó là một BTC Weekly Close thực sự tốt”, nhà giao dịch nổi tiếng và nhà phân tích Rekt Capital trả lời.
“$BTC đã giảm ~$27600 như hỗ trợ hai tuần trước và bây giờ đã định vị chính nó để kiểm tra lại/đòi lại cùng mức này.”

Rekt Capital trước đó đã cảnh báo về một sự cố lớn hơn đang lờ mờ, có thể đưa giá BTC trở lại $20,000.
“Nhúng vào màu đen sẽ khỏe mạnh và thành công thử nghiệm lại có thể định vị BTC cho một chuyến thăm lại của ~$28800,” ông nói, đánh dấu khu vực giữ trong trường hợp có sự giảm giá tiếp theo để hỗ trợ.
Analysis further raised the possibility of Bitcoin invalidating a recently-formed head and shoulders pattern on daily timeframes, this typically linked to the start of a long-term bearish phase.
#BTC has successfully Daily Closed above the red box top
Now a dip for a retest of the red box top may now be in progress
A successful retest at $27600 would not only set $BTC up for a revisit for the higher $28000s
But also invalidate the Head & Shoulders#Crypto #Bitcoin https://t.co/bhED0LiXV8 pic.twitter.com/p1wZvJh3KU
— Rekt Capital (@rektcapital) May 29, 2023
“BTC is in a very early Bull Market,” Rekt Capital added.
CME gap guides BTC price dip bets
With that, Bitcoin is providing fuel for debate as bulls inch closer to testing the top of what has been a stubborn multi-month trading range.
Those betting on downside continuing this week have already been caught short — literally. Short traders saw $44 million of positions liquidated on May 28 alone, which according to monitoring resource CoinGlass represents a one-month high.
This move up is just bears getting squeezed shorting, sideways action as bears reload their shorts, then another squeeze stopping them out again, rinse and repeat lol. We probs continue pushing up until these bears calm tf down. $BTC https://t.co/VSB7mqts9q pic.twitter.com/rEhyHmtfLY
— CrediBULL Crypto (@CredibleCrypto) May 29, 2023
For well-known market participants, however, there is still cause to stay conservative on what comes next.
Trader Skew noted that Bitcoin’s weekend upside had opened up a gap in CME futures, with the implication that BTC/USD should dip lower to “fill” it at the open.
“Could see a sell off post debt ceiling deal & then gold / btc go on a run before the final rug,” part of Twitter commentary stated on May 29.

Fellow trader Mark Cullen noted that bid liquidity from nearer $25,000 had shifted higher, with traders anxious to get buy orders filled.
“Every time I do this I tend to kick myself as the would have been filled in the end,” he acknowledged, suggesting that a return toward that level remained on the table.
Trader Daan Crypto Trades meanwhile said that the battle for upside continuation was still ongoing, with a “key” resistance level still to be won.
#Bitcoin Testing the upper resistance of this flag/wedge.
Upon confirmation of a breakout, this should lead to the next leg higher up. pic.twitter.com/089VoJwBHG
— Daan Crypto Trades (@DaanCrypto) May 29, 2023
A new milestone for Bitcoin difficulty
For Bitcoin network fundamentals, the trend is as decisively bullish as at any time this year — and new all-time highs are near.
Mining difficulty is due to add 2.5% on May 31, taking it over 50 trillion for the first time ever according to data resource BTC.com.
Add hash rate into the equation, itself circling the highest levels ever recorded, and the picture becomes clear regarding miner conviction and competition.

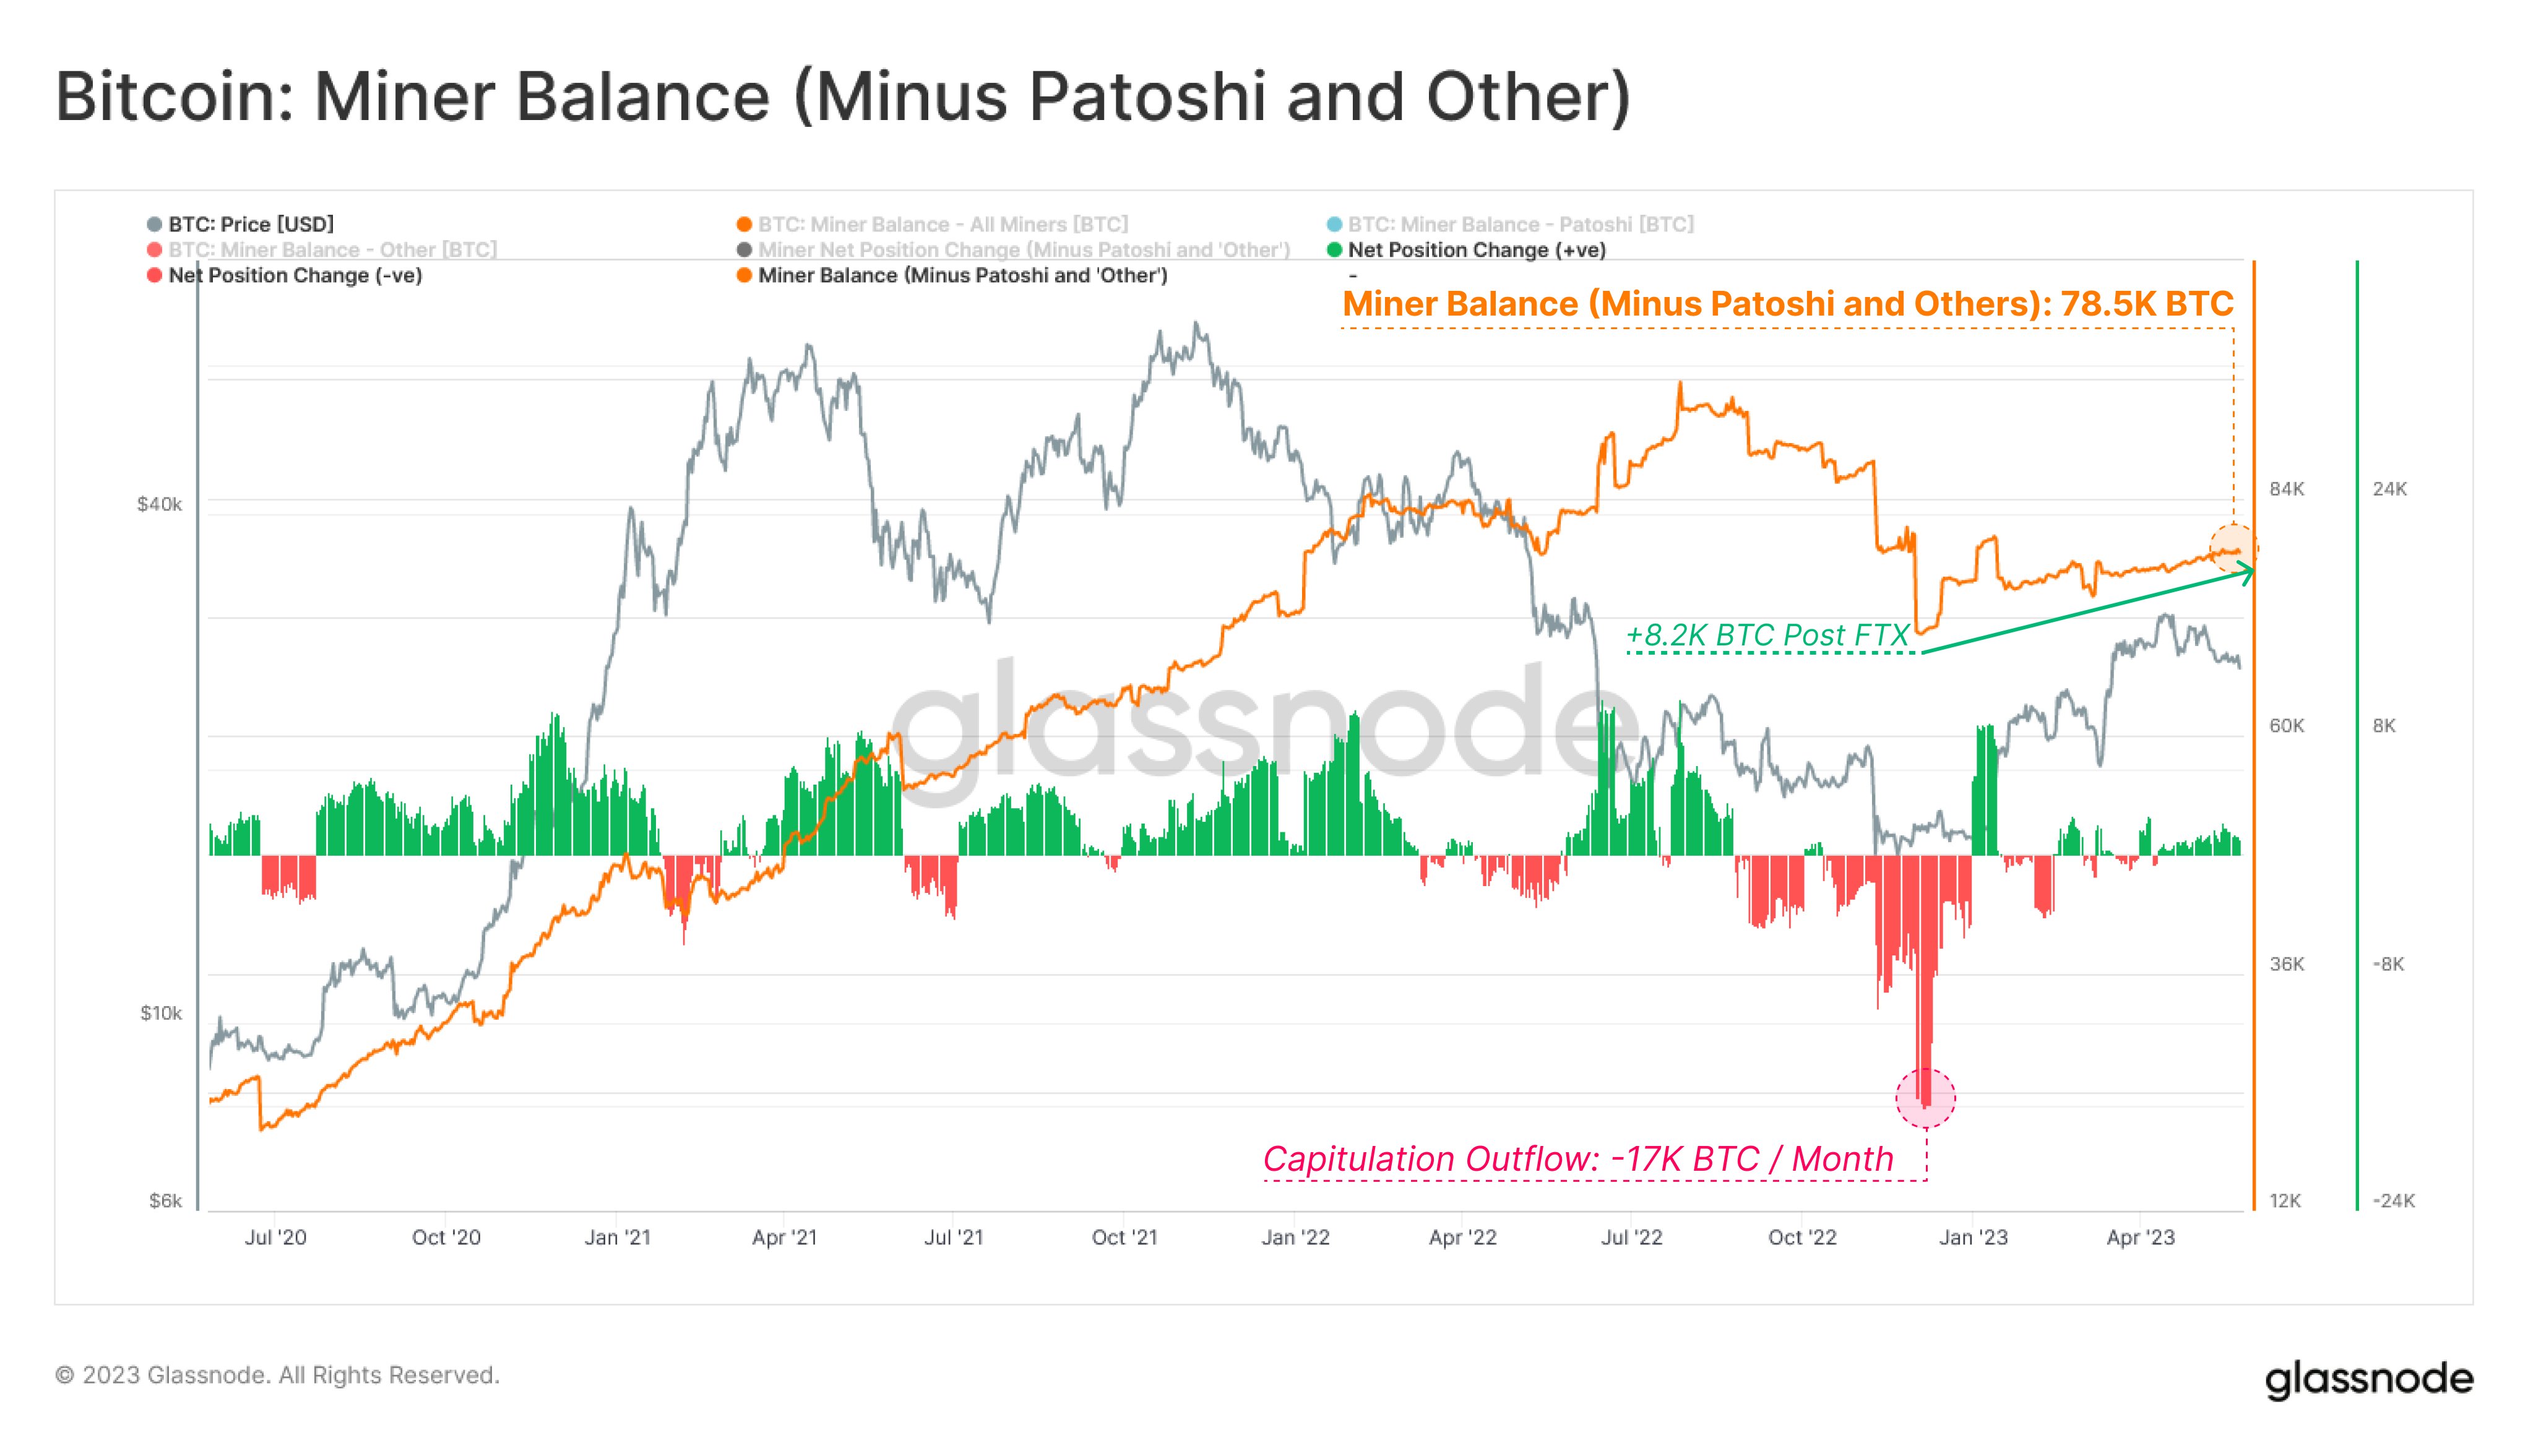
As noted by analytics firm Glassnode last week, meanwhile, miners have returned to hodling — increasing their overall BTC balances by retaining more BTC earnings than they sell.
“Following a large outflow of Bitcoin across the FTX implosion, Miners (excluding Patoshi and early unlabelled Miners) have expanded their balance sheet by +8.2K BTC, increasing their holdings to a total of 78.5K BTC,” it noted alongside a chart.

William Clemente, head of crypto research firm Reflexivity Research, meanwhile contrasted the current trend in hash rate versus spot price with Bitcoin’s 2019 price recovery.
One of the biggest differences between this Bitcoin bear market and the last one is that in 2019 hash rate didn’t reach new highs until BTC ~3xed off its lows while today hash rate has over 2xed its prior May 2021 high while BTC itself is only up 75% off its lows pic.twitter.com/PMs9vn467Z
— Will Clemente (@WClementeIII) May 23, 2023
As Cointelegraph often reports, a popular mantra still held by some longtime market participants focuses on spot price following hash rate on longer timeframes.
Hodl trend in “up only” mode
Onoing monitoring of Bitcoin hodlers produces few surprises — long-term investors refuse to sell, ferreting away more of the supply on a daily basis.
Less and less BTC is thus available for purchases as dedicated buyers send Glassnode’s “Hodled and Lost Coins” metric to multi-year highs.
At 7,725,079 BTC, these “Hodled and Lost Coins” now account for more BTC than at any time since May 2018.

This month, Cointelegraph reported on short-term price trends depending increasingly on the actions of short-term holders, typically correlated with speculative trading activity.
These investors, who have held BTC for 155 days or less, currently have a cost basis of $26,500, making that level a key, and so far successful, support zone.
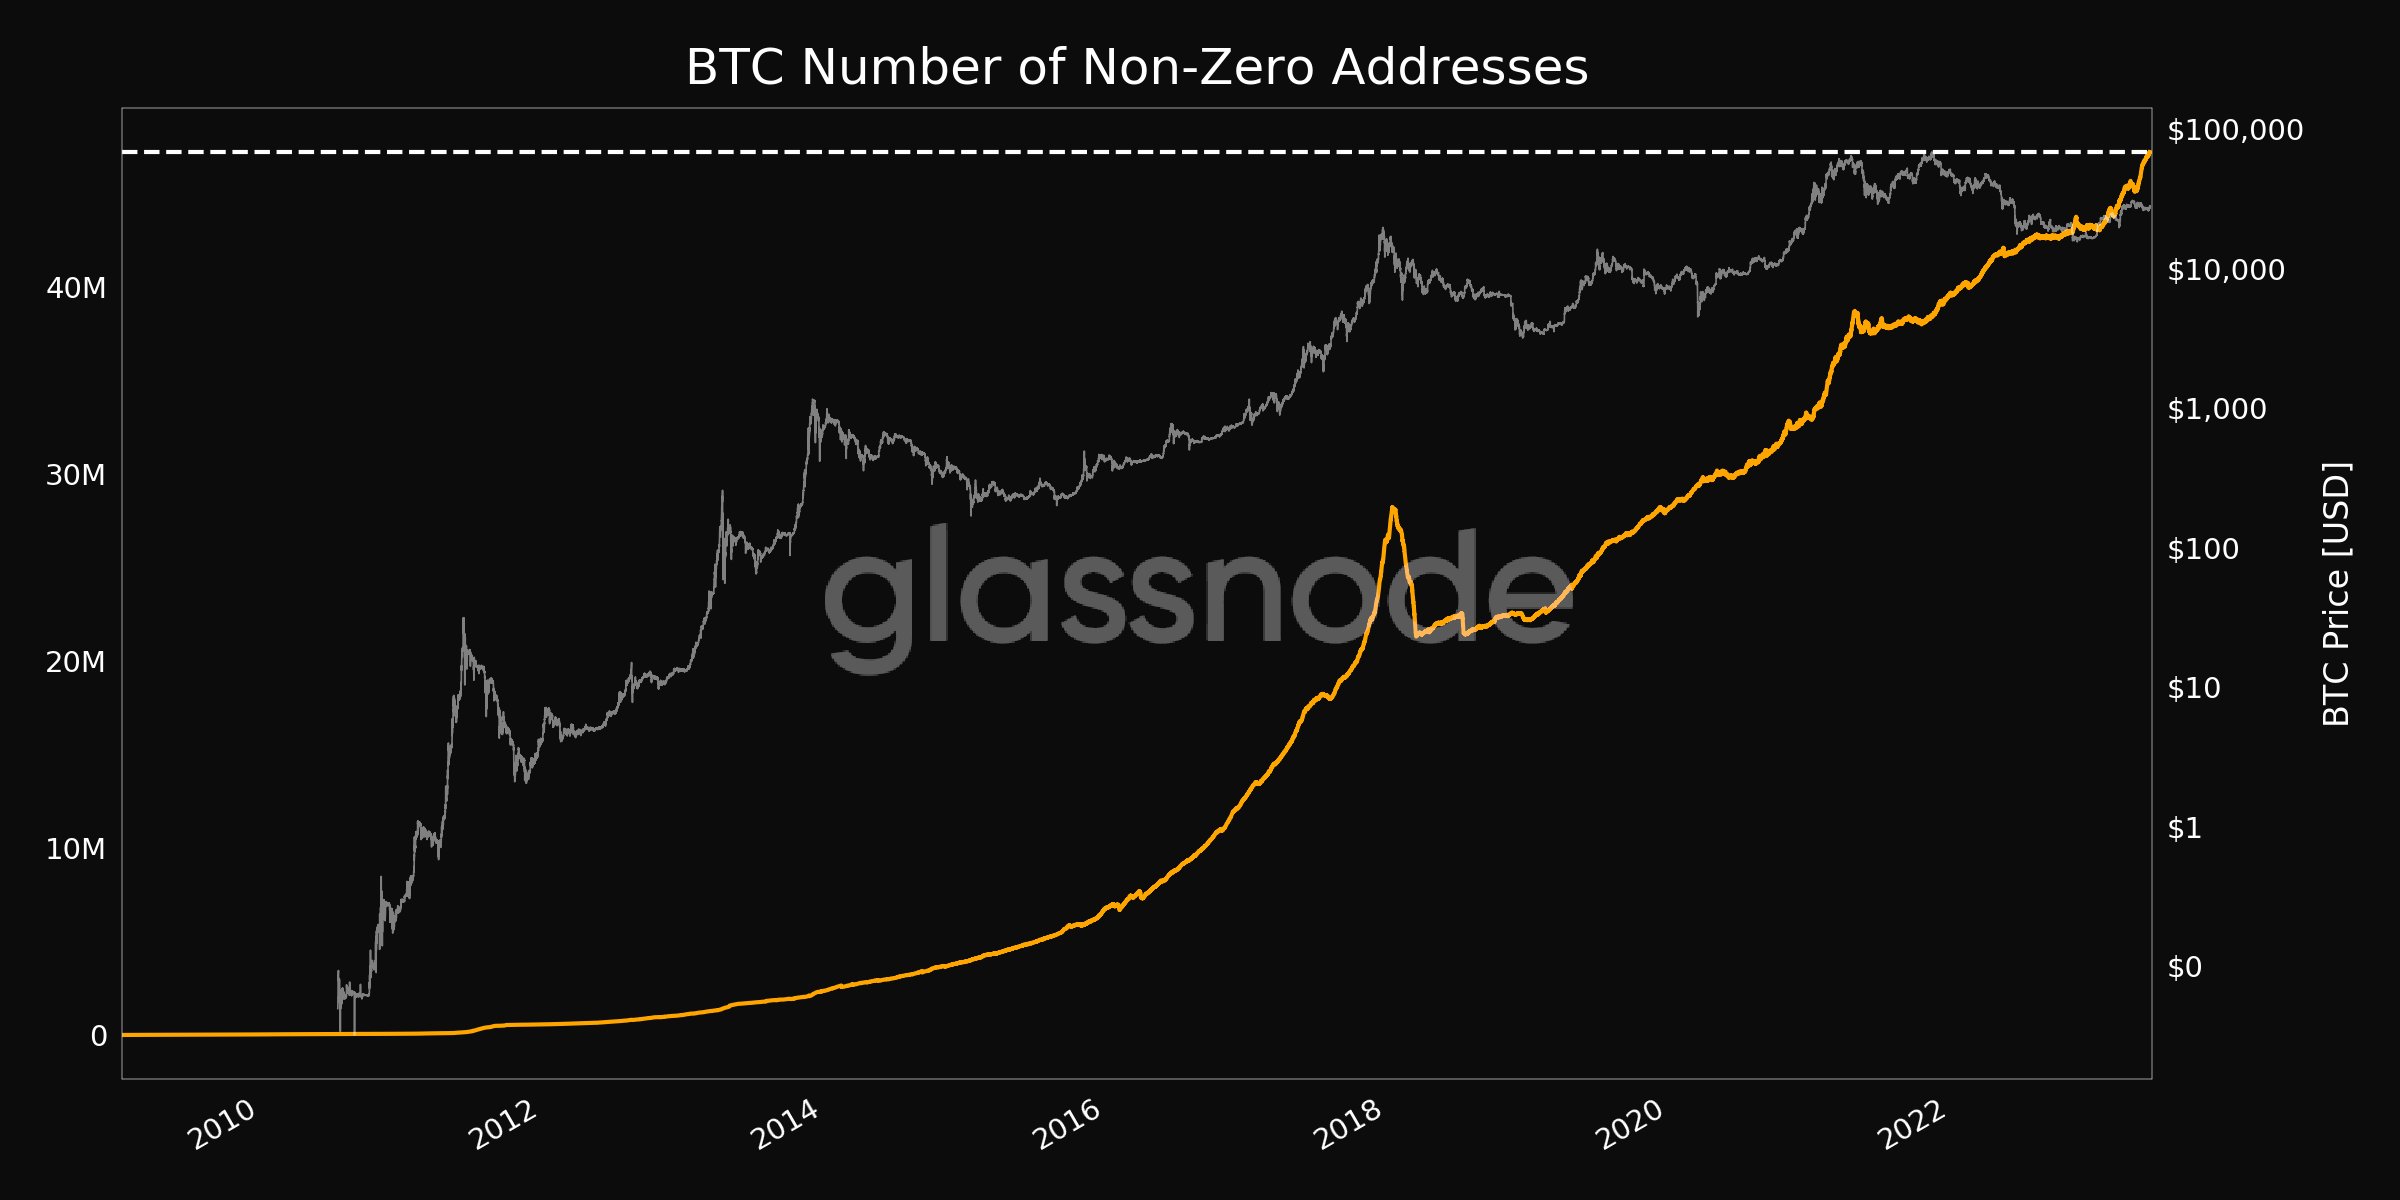
Additional findings meanwhile reveal that there are also now more Bitcoin wallets with a non-zero address than ever before — over 47 million.

MACD crossover may spark 50% gains
The return of a 2023 bull signal is giving some pause for thought this week.
Related: Bitcoin holds 200-week average as trader says ‘inflection point’ is here
Moving Average Convergence Divergence (MACD), a bullish crossover, which was followed by at least 40% upside on two occasions this year, has just seen another such event.
The move was noted by popular trader, Captain Faibik, who confirmed the move occurring on May 27.
$BTC MACD Bullish Crossover on Daily TF Chart.
In January and March 2023, Bitcoin Experienced Substantial Surges of around 40% and 50% Respectively following the MACD Bullish Crossover.
Will History Repeat itself?#Crypto #Bitcoin #BTC pic.twitter.com/XLISw3Yg9b
— Captain Faibik (@CryptoFaibik) May 29, 2023
MACD subtracts the 26-period exponential moving average (EMA) from its 12-period equivalent.
A nine-day EMA of the result creates a so-called “signal line,” which when compared to the MACD value offers a form of Bitcoin top and bottom signal.
Magazine: ‘Moral responsibility’: Can blockchain really improve trust in AI?
This article does not contain investment advice or recommendations. Every investment and trading move involves risk, and readers should conduct their own research when making a decision.


