Bitcoin (BTC) đã tăng trên $19,000 vào ngày 12 tháng Giêng, mức cao nhất kể từ ngày 8 tháng 11. Mặc dù thị trường bò có thể không bắt đầu vội vàng, dữ liệu Glassnode cho thấy nền tảng cho một đáy vĩ mô trong Bitcoin có thể được đặt ra. Công ty phân tích trên chuỗi đã tweet vào ngày 12 tháng Giêng rằng “13% Nguồn cung lưu hành” đã trở lại lợi nhuận khi Bitcoin tăng lên $18,200. Điều này cho thấy một giai đoạn tích lũy lớn đã diễn ra trong phạm vi 16.500 đến $18.200.
Cùng với Bitcoin, Ether (ETH) cũng đang chứng kiến các dấu hiệu tích lũy. Số lượng cá mập Ethereum, nắm giữ từ 100 đến 10.000 Ether, đã tăng 3.000 kể từ ngày 22 tháng 11, theo số liệu của Santiment.

Nhiều lần, các nhà giao dịch bỏ lỡ một đáy vì họ vẫn phủ nhận. Nếu các nhà giao dịch muốn bắt kịp xu hướng sớm, họ nên theo dõi chặt chẽ hành động giá vì một chuỗi các mức cao hơn và thấp hơn có thể cho thấy tâm lý tăng.
Bitcoin và altcoins có dấu hiệu bắt đầu xu hướng tăng mới không? Hãy nghiên cứu các biểu đồ của 10 loại tiền điện tử hàng đầu để tìm hiểu.
BTC/USDT
Bitcoin đang trên con đường phục hồi. Sự mua mạnh mẽ của những con bò đã đẩy giá lên trên mức kháng cự trên không ở mức $18,388 vào ngày 12 tháng Giêng. Đây là dấu hiệu đầu tiên cho thấy những con gấu có thể đang mất khả năng nắm bắt.

Sự tăng mạnh trong vài ngày qua đã đẩy chỉ số sức mạnh tương đối (RSI) vào vùng quá mua, báo hiệu một sự điều chỉnh hoặc củng cố có thể trong ngắn hạn.
Nếu bulls không cho phép giá giảm xuống dưới mức phá vỡ $18,388, nó sẽ cho thấy một sự thay đổi trong tâm lý từ bán trên các cuộc tăng sang mua trên các điểm giảm. Cặp BTC/USDT sau đó có thể tiếp tục phục hồi hướng đến mức kháng cự chính tiếp theo ở mức 21,500 USD.
Nếu những người bán muốn làm chậm đà tích cực, họ sẽ phải nhanh chóng kéo giá trở lại dưới $18,388. Cặp này sau đó có thể giảm xuống đường trung bình động cấp số mũ 20 ngày ($17,378).
ETH/USDT
Ether tăng lên trên mức kháng cự trên không $1,352 vào ngày 11 tháng Giêng và tiếp theo đó tăng lên với một sự phá vỡ trên đường xu hướng giảm vào ngày 12 tháng Giêng. Điều này cho thấy rằng những con bò đực đang trên đà trở lại mạnh mẽ.

Những người bán sẽ cố gắng trì hoãn sự phục hồi và kéo giá trở lại dưới mức phá vỡ $1,352. Nếu điều đó xảy ra, cặp ETH/USDT có thể trượt xuống đường EMA 20 ngày ($1,292). Một sự bật lên mạnh mẽ từ mức này sẽ cho thấy các nhà giao dịch đang mua các mức giảm. Điều đó có thể cải thiện triển vọng của một cuộc tăng lên 1.700 đô la Mỹ. Mức này một lần nữa có thể hoạt động như một trở ngại mạnh mẽ.
điểm tích cực có thể làm mất hiệu lực nếu giá giảm và giảm xuống dưới đường trung bình. Một động thái như vậy có thể chỉ ra rằng sự đột phá gần đây có thể là một cái bẫy bò.
BNB/USDT
BNB (BNB) bật lên khỏi đường SMA 50 ngày ($268) vào ngày 10 tháng Giêng và tiếp tục hành quân hướng bắc. Giá gần $300, nơi mà những người giảm có thể có một kháng cự mạnh.

số EMA tăng 20 ngày ($266) và RSI gần vùng quá mua cho thấy lợi thế cho người mua. Nếu giá giảm từ $300, nó có thể tìm thấy hỗ trợ tại đường EMA 20 ngày ($266). Một sự bật lên mạnh mẽ từ mức này có thể đẩy cặp BNB/USDT lên vùng kháng cự $318 đến $338.
Trái với giả định này, nếu giá giảm và trượt xuống dưới đường trung bình động, cặp tiền có thể kiểm tra lại vùng hỗ trợ $250 đến $236.
XRP/USDT
XRP (XRP) dipped below the 50-day SMA ($0.37) on June 12 but the bulls successfully defended the breakout level from the symmetrical triangle.

The gradually upsloping 20-day EMA ($0.35) and the RSI in the positive zone indicate that bulls have the upper hand. Buyers will try to drive the price above $0.38 and extend the up-move to $0.42.
Conversely, if the price fails to sustain above the 50-day SMA ($0.37), the bears will again try to pull the XRP/USDT pair back into the triangle. If they do that, the pair could tumble to the support line of the triangle.
ADA/USDT
The bears tried to sink Cardano (ADA) back into the wedge on Jan. 11 but the long tail on the candlestick shows strong buying at lower levels.

The ADA/USDT pair has continued its up-move, which has pushed the RSI into the overbought territory. This suggests that the rally may be overheated in the near term and the pair could enter a short-term correction or consolidation.
If the price turns down from the current level but rebounds off the 20-day EMA ($0.29), it will suggest demand at lower levels. Buyers will then again try to clear the hurdle at $0.35 and launch a rally to $0.38 and later to $0.44. The bears will have to yank the price below the moving averages to gain the upper hand.
DOGE/USDT
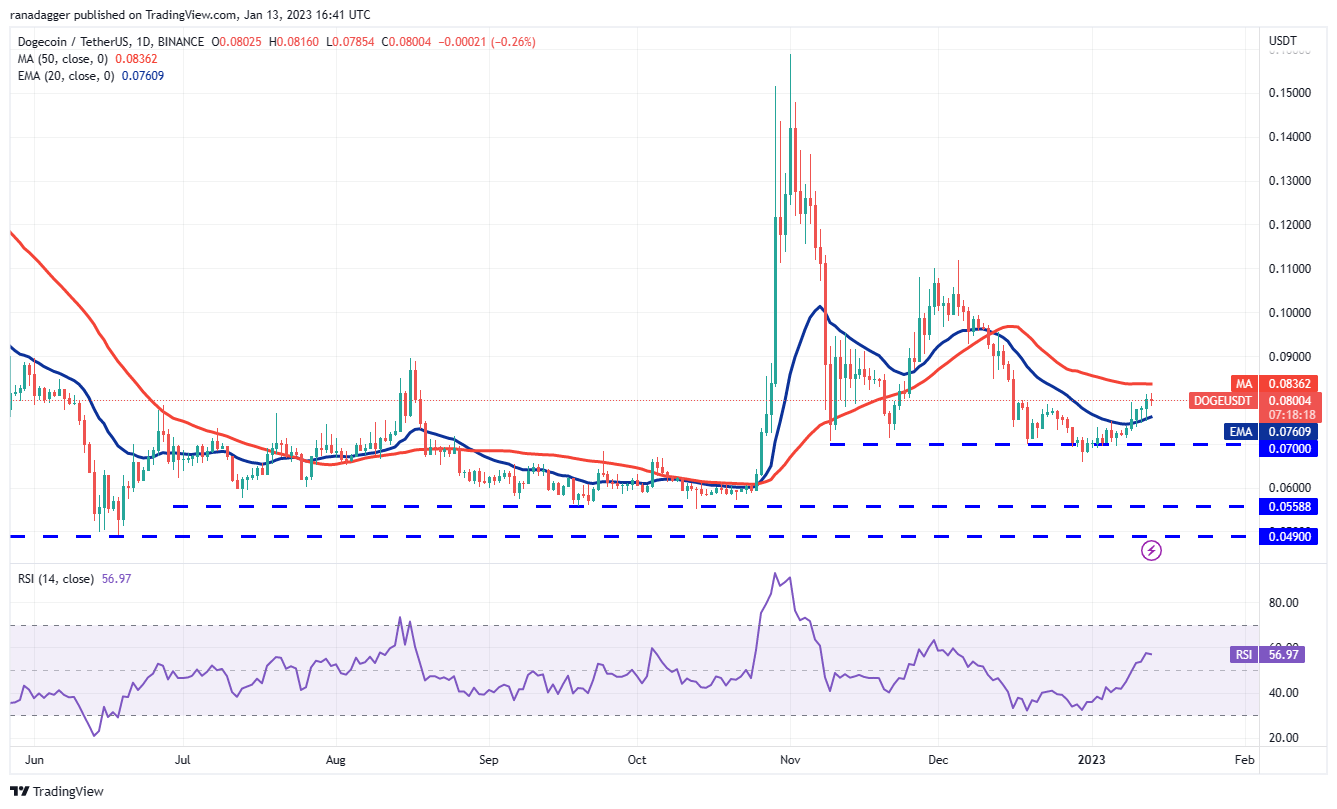
The bears tried to pull Dogecoin (DOGE) below the 20-day EMA ($0.07) on Jan. 11 and 12 but the bulls held their ground. Buyers are trying to kick the price above the 50-day SMA ($0.08) on Jan. 13.

If they manage to do that, the DOGE/USDT pair could pick up pace and start a rally toward $0.11. This level may witness strong selling by the bears. If the price turns down sharply from it, there is a possibility that the pair may stay range-bound between $0.07 and $0.11 for some time.
Another possibility is that the price turns down from the 50-day SMA and tumbles below the 20-day EMA. That will suggest a negative sentiment and may keep the pair stuck between the 50-day SMA and $0.07 for a while longer.
MATIC/USDT
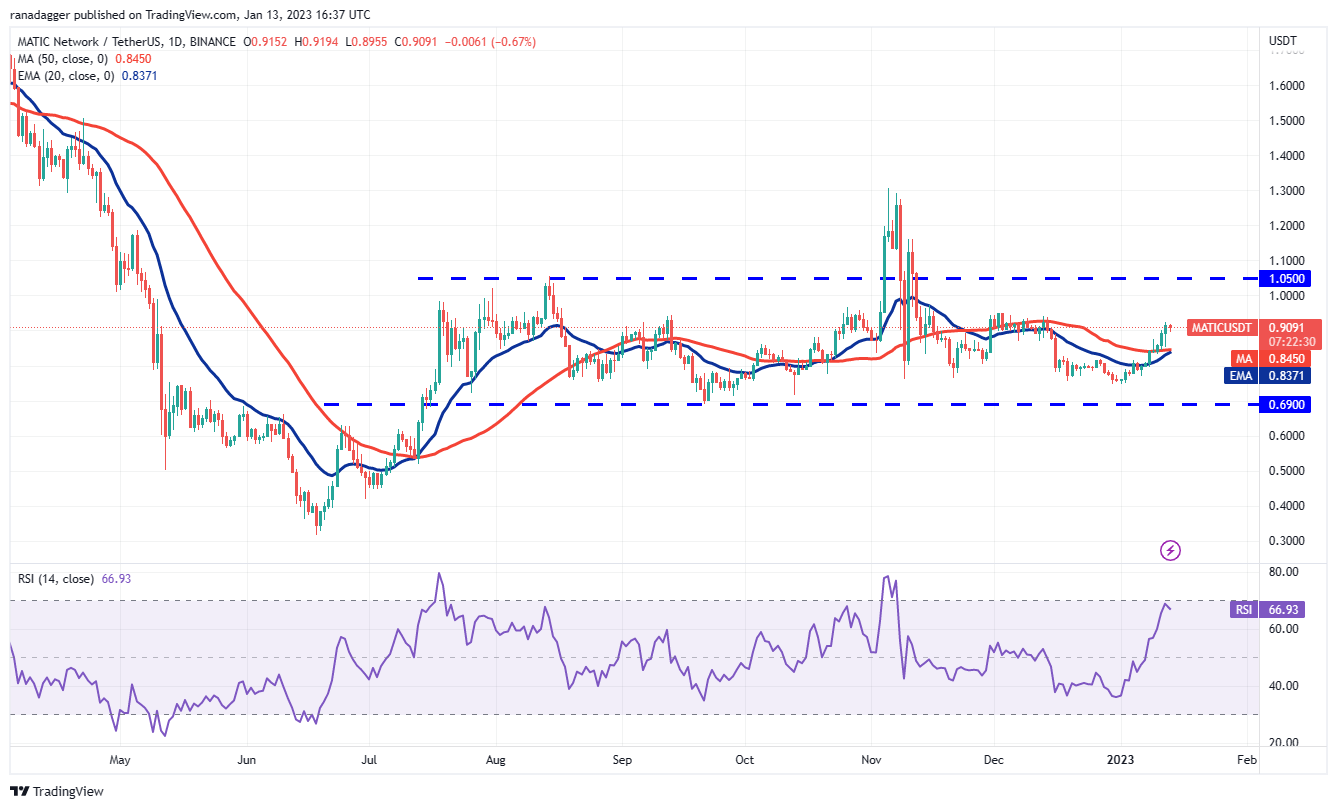
The long tail on Polygon’s (MATIC) Jan. 12 candlestick shows that traders are buying the dips to the moving averages. Buyers will try to push the price to $0.97, which may act as a roadblock.

The 20-day EMA ($0.84) has started to turn up and the RSI is near 67, signaling that the path of least resistance is to the upside. If the bulls do not give up much ground from $0.97, the MATIC/USDT pair could continue its up-move and touch $1.05.
As the pair has been stuck inside the large range between $0.69 and $1.05 for the past several days, the bears may sell aggressively near the resistance. On the downside, a drop below the moving averages could tilt the short-term advantage in favor of the sellers.
Related: Bitcoin price wants to retest 2017 all-time high near $20K — analysis
LTC/USDT
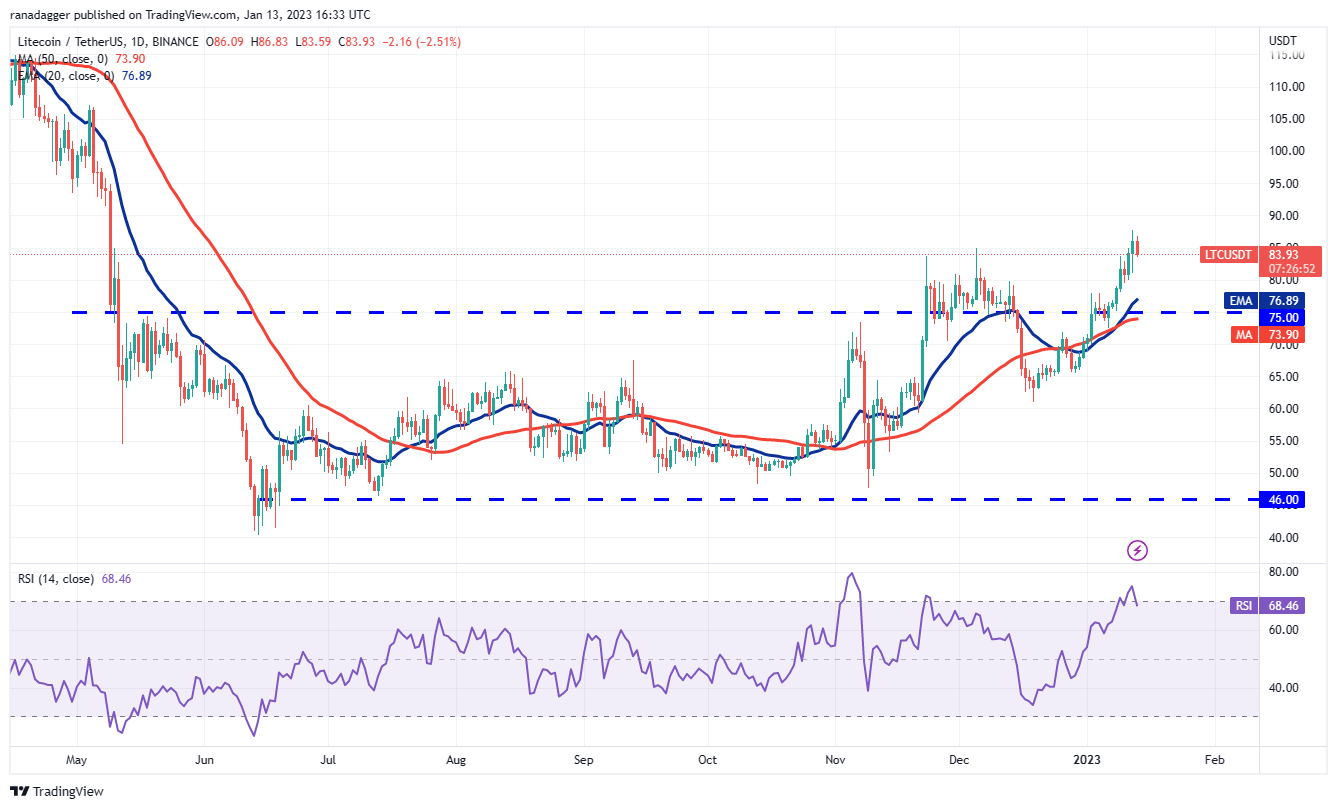
After facing resistance at $85 for a few days, Litecoin (LTC) soared above the level on Jan. 12. However, the bulls are struggling to sustain the higher levels.

If the price falls and closes below $85, it will suggest that the bears have not yet given up. The sellers will then try to sink the price to the 20-day EMA ($77).
This is an important level to keep an eye on because a strong rebound off it will suggest that the sentiment is positive and traders are buying on pullbacks. The bulls will then again attempt to thrust the LTC/USDT pair above the overhead resistance and resume the uptrend toward $100.
The bears will gain the upper hand if they drag the price below the 50-day SMA ($74). That could open the doors for a decline to $61.
DOT/USDT
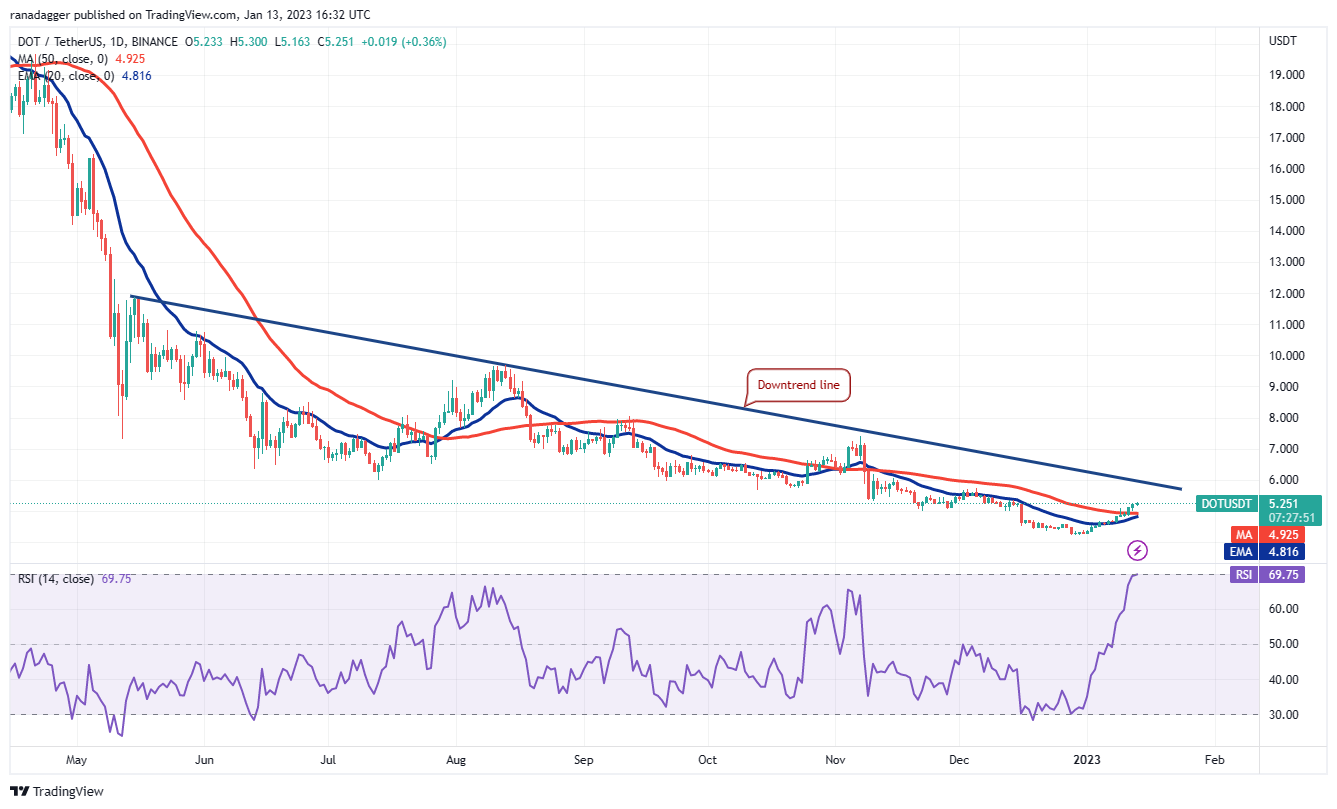
The bears tried to halt Polkadot’s (DOT) recovery at the 50-day SMA ($4.92) on Jan. 9 and 10 but the bulls did not surrender. They bulldozed their way above the resistance on Jan. 11.

The DOT/USDT pair will try to touch the downtrend line. The sellers have halted recovery attempts near the downtrend line on three previous occasions, hence they will try to repeat their performance.
If the price turns down from this resistance but turns up from the moving averages, it will suggest a change in sentiment from selling on rallies to buying on dips. The bulls will then again attempt to propel the pair above the downtrend line.
This positive view will be negated if the price turns lower and plummets below the moving averages.
UNI/USDT
Uniswap (UNI) reached close to the resistance line of the symmetrical triangle on Jan. 12 but the bulls could not clear this hurdle. That may have tempted short-term traders to book profits.

The 20-day EMA ($5.62) has started to turn up and the RSI is in the positive zone, indicating that buyers have a slight edge. If the price springs back from the 20-day EMA, the bulls will again attempt to drive the UNI/USDT pair above the triangle. If they succeed, it will suggest the start of a new up-move that could reach $7.80.
On the contrary, if the price slumps below the moving averages, it will suggest that the pair may remain stuck inside the triangle for a few more days.
The views, thoughts and opinions expressed here are the authors’ alone and do not necessarily reflect or represent the views and opinions of Cointelegraph.
This article does not contain investment advice or recommendations. Every investment and trading move involves risk, and readers should conduct their own research when making a decision.


