Giá Bitcoin (BTC) đã tăng khoảng 37% so với năm nay và không có dấu hiệu chậm lại. Chỉ số S & P 500 (SPX) cũng đã có một khởi đầu chiến thắng trong năm nay nhưng đã chứng kiến một cuộc tăng tương đối im lặng khoảng 4%.
Trong khi giá tài sản rủi ro đang tăng, chỉ số đô la Mỹ (DXY), được coi là một thiên đường an toàn, mở rộng xu hướng giảm và giảm hơn 1% trong tháng Giêng.
Sự thay đổi tâm lý đối với tài sản rủi ro có thể đã được kích hoạt bởi kỳ vọng rằng Cục Dự trữ Liên bang Hoa Kỳ có thể làm chậm mức tăng lãi suất khi lạm phát nguội đi. Một số nhà phân tích thậm chí còn hy vọng Fed sẽ xoay và bắt đầu cắt giảm lãi suất trước khi kết thúc năm nay.

Một số nhà phân tích vẫn hoài nghi về sự tăng giá của Bitcoin nhưng giá càng duy trì trên $20,000, thì khả năng mức thấp vĩ mô có thể đã được thực hiện trong tháng Mười Một càng lớn. Nếu sự suy giảm tiếp theo tạo thành mức thấp hơn, nó có thể xác nhận thêm rằng điều tồi tệ nhất có thể đằng sau chúng tôi.
Liệu cuộc biểu tình ở Bitcoin và altcoins có thể chứng kiến lợi nhuận đặt phòng trong vài ngày tới? Hãy nghiên cứu các biểu đồ để tìm hiểu.
SPX
số S & P 500 đảo chiều từ đường xu hướng giảm vào ngày 18 tháng Một và giảm xuống dưới đường trung bình động vào ngày 19 tháng Một nhưng những người bán không thể duy trì được mức thấp hơn.

Những con bò đã mua xu hướng giảm vào ngày 20 tháng Một và đẩy giá trở lại trên đường trung bình. Người mua đã xây dựng trên sức mạnh này và đang cố gắng xóa chướng ngại vật trên không tại đường xu hướng giảm vào ngày 23 tháng Một. Nếu họ quản lý để làm điều đó, nó sẽ gợi ý một sự thay đổi xu hướng tiềm năng. Chỉ số này có thể tăng lên 4,325 với điểm dừng nhỏ ở mức 4,100.
Trái với giả định này, nếu chỉ số không duy trì được trên đường xu hướng giảm, nó sẽ cho thấy rằng những người bán đang hoạt động ở mức cao hơn.
Một sự phá vỡ dưới 3,885 có thể nghiêng lợi thế ngắn hạn có lợi cho người bán. Chỉ số này sau đó có thể giảm xuống còn 3,764.
DXY
Chỉ số đô la Mỹ (DXY) tiếp tục có xu hướng giảm. Người mua đã cố gắng bắt đầu phục hồi vào ngày 18 tháng Một nhưng những người bán không thụt giảm.
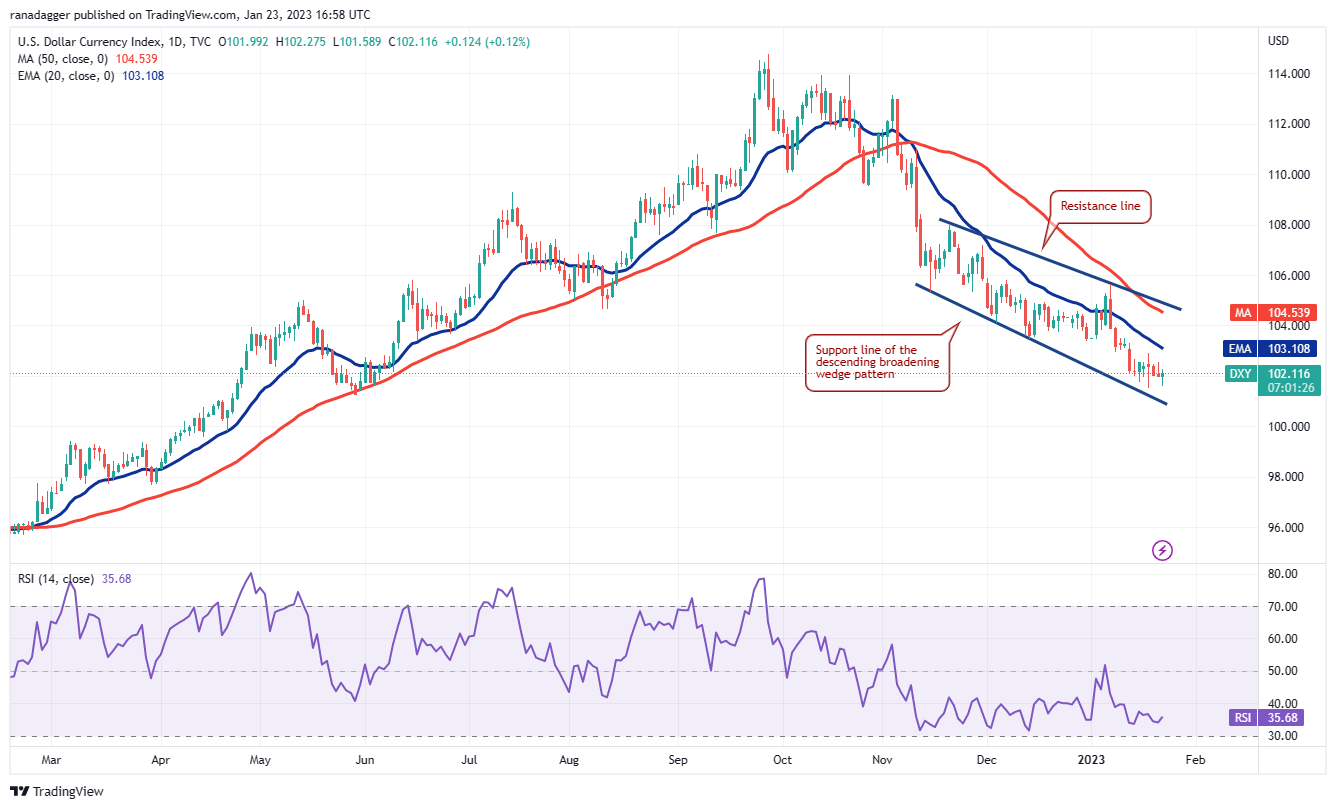
trung bình di chuyển xuống dốc và RSI trong vùng tiêu cực cho thấy những người bán đang đứng vững trong vị trí lái xe. Người mua có thể cố gắng bảo vệ đường hỗ trợ của mô hình nêm mở rộng giảm dần nhưng có thể phải đối mặt với việc bán mạnh tại đường EMA 20 ngày (103).
Về mặt nhược điểm, người mua có khả năng bảo vệ mức tâm lý 100 vì nếu hỗ trợ này bị nứt, việc bán có thể tăng cường và chỉ số này có thể giảm xuống còn 97.
Dấu hiệu đầu tiên của sức mạnh sẽ là sự phá vỡ trên đường EMA 20 ngày. Điều đó có thể mở ra cánh cửa cho một cuộc biểu tình có thể xảy ra với đường kháng cự của nêm.
BTC/USDT
Những con bò đã đẩy Bitcoin lên trên 22,800 USD vào ngày 21 tháng Giêng và 22 tháng Giêng nhưng bấc dài trên nến cho thấy gấu đang bán ở mức cao hơn. Những con gấu đã cố gắng để bắt đầu một sự điều chỉnh vào ngày 22 tháng Một nhưng những con bò đã mua xu hướng giảm trong ngày như được nhìn thấy từ đuôi dài trên nến.
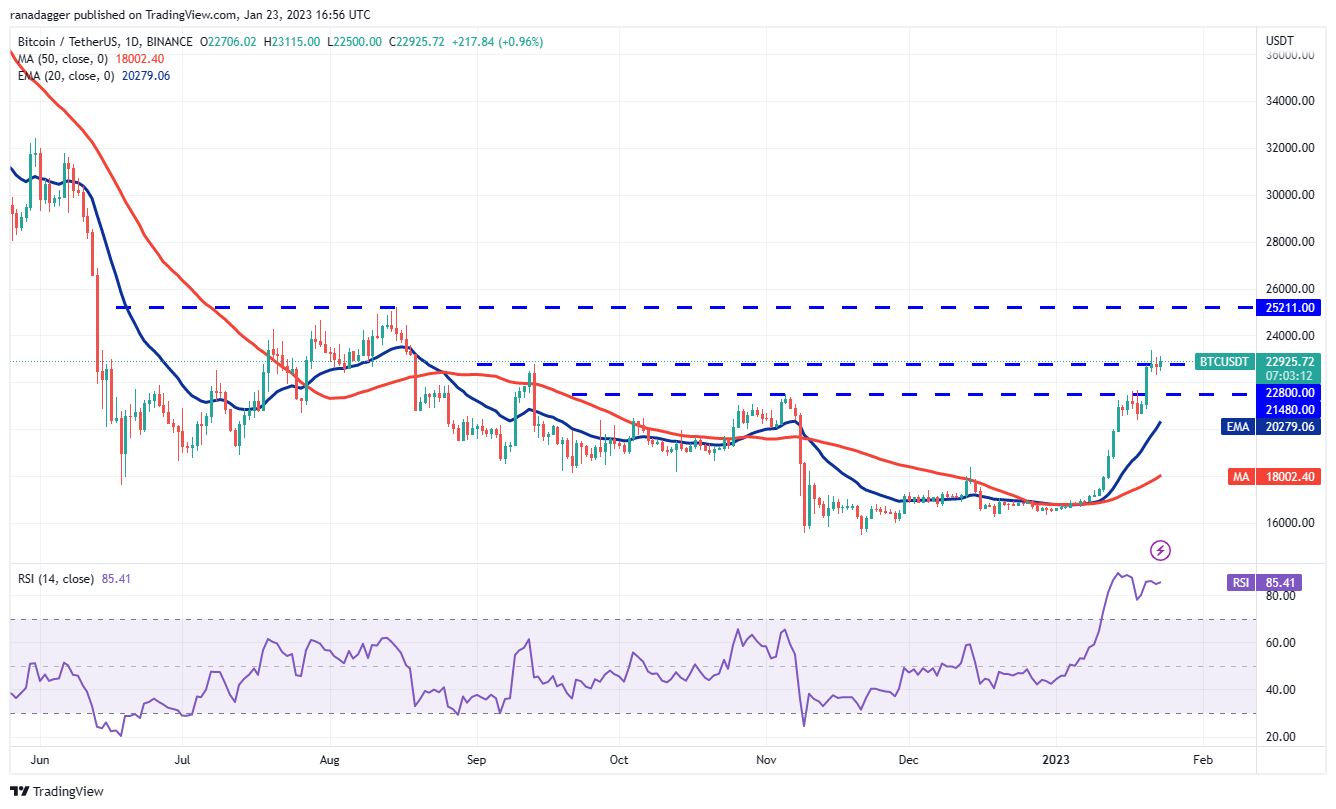
Mặc dù đường trung bình di chuyển lên cho thấy lợi thế cho người mua, RSI trong vùng quá mua cảnh báo rằng một sự điều chỉnh nhỏ hoặc củng cố là có thể. Để điều đó xảy ra, những người bán sẽ phải kéo và duy trì giá dưới $22,292. Cặp BTC/USDT sau đó có thể trượt xuống 21,480 USD.
Ngược lại, nếu người mua đẩy giá lên trên vùng kháng cự $23,078 lên $23,371, cặp này có thể tăng tốc lên $25,211. Những người bán có thể bảo vệ mạnh ở mức này, điều này có thể dẫn đến sự điều chỉnh ngắn hạn.
ETH/USDT
Ether’s (ETH) price is facing rejection at $1,680 but a positive sign is that the bulls have not ceded ground to the bears. This suggests that the short-term traders are holding their positions as they anticipate the up-move to continue.
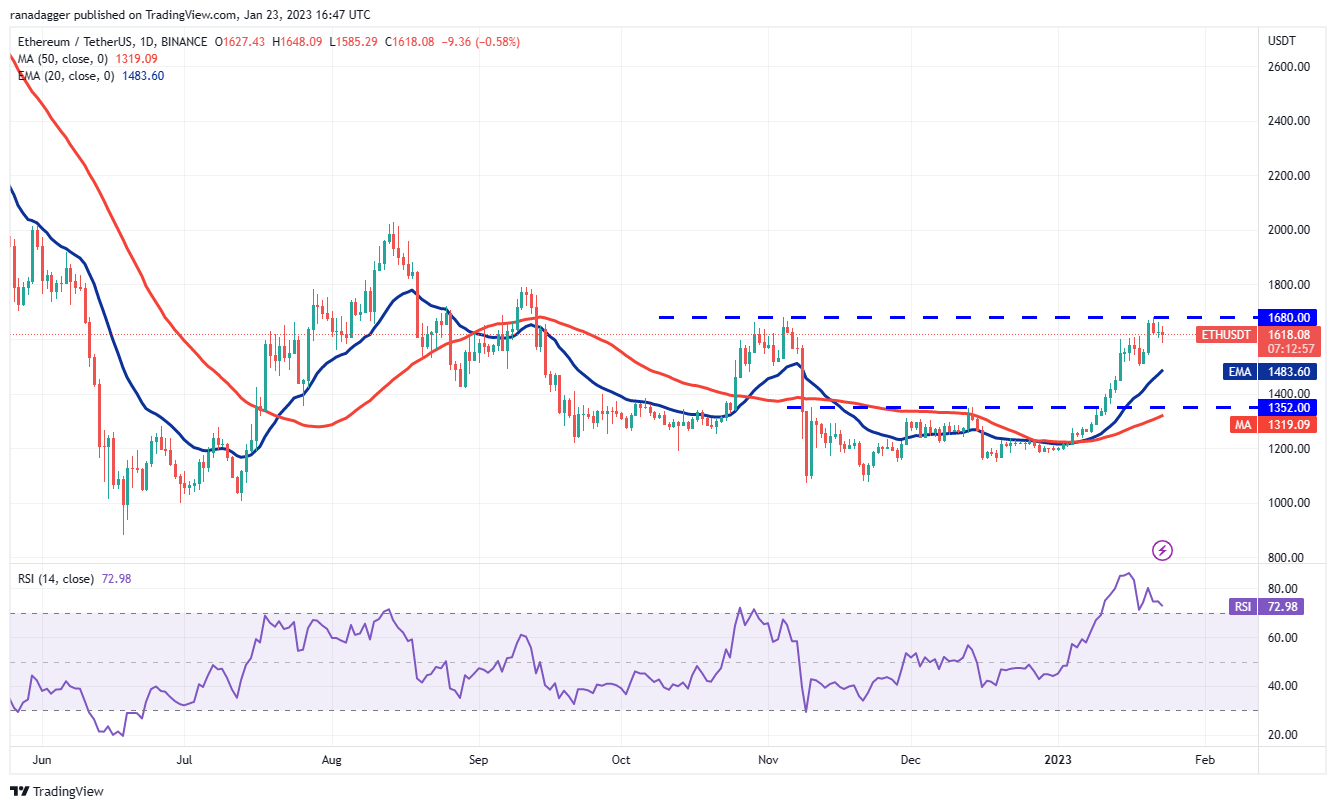
The rising 20-day EMA ($1,483) and the RSI in the overbought territory suggest the path of least resistance is to the upside.
A break and close above $1,680 could start the journey to $1,800. This level may again act as a resistance but if bulls do not allow the price to slip below $1,680 during the next pullback, the likelihood of a rally to $2,000 increases.
This positive view could invalidate in the near term if the price turns down from the current level and slumps below the 20-day EMA. The ETH/USDT pair could then remain range-bound between $1,352 and $1,680 for some time.
BNB/USDT
BNB’s (BNB) relief rally is facing selling near the overhead resistance at $318 but the bulls have not ceded ground to the bears. This suggests that buyers are not rushing to the exit as they expect the price to rise above $318.
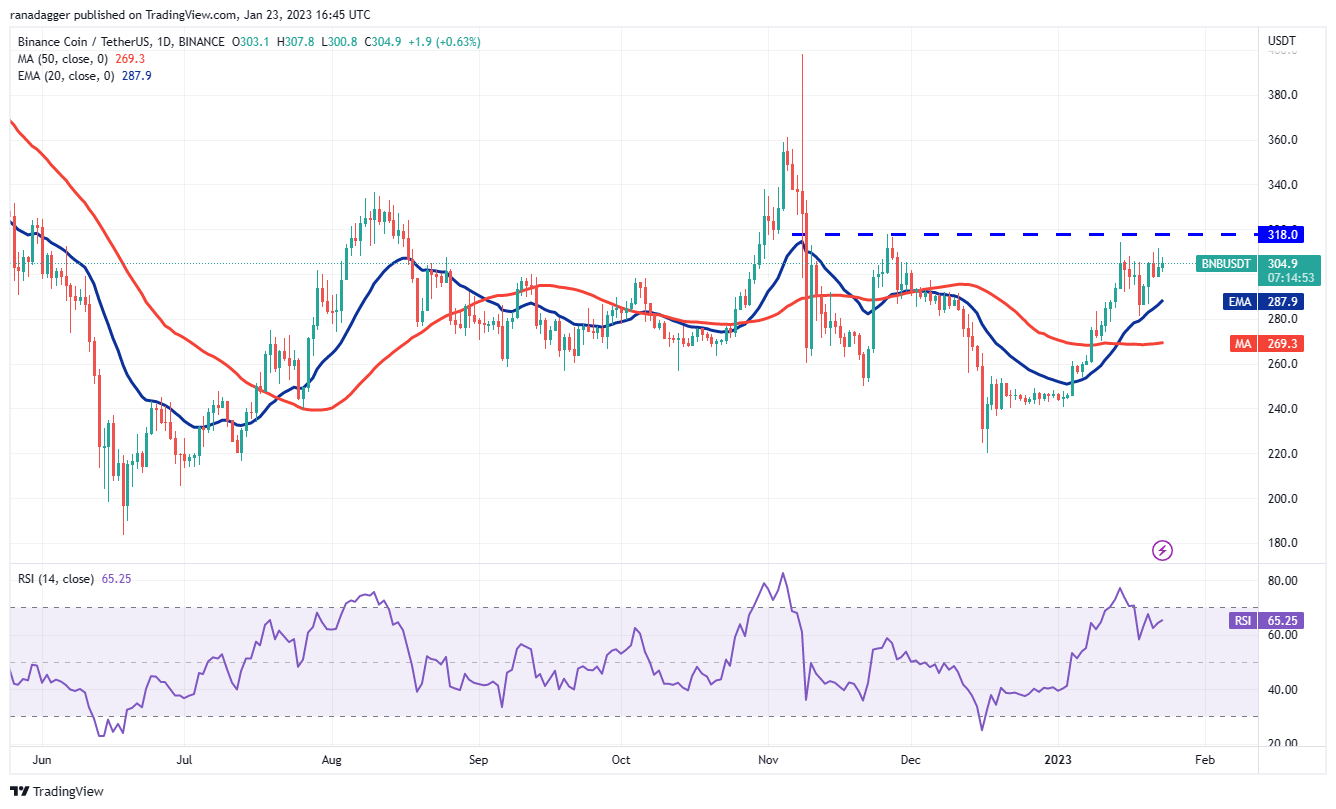
The upsloping 20-day EMA ($287) and the RSI in the positive zone indicate that bulls have the upper hand. If buyers thrust the price above $318, the BNB/USDT pair could accelerate to $360 as there is no major resistance in between.
If the price turns down sharply from the current level, the pair could drop to the 20-day EMA. This level may attract strong buying by the bulls. If the price rebounds off the 20-day EMA, the buyers will again try to clear the overhead hurdle at $318 and resume the uptrend. The short-term advantage could tilt in favor of the bears on a break below the 50-day simple moving average ($269).
XRP/USDT
After a shallow two-day pullback, buyers pushed XRP (XRP) above the stiff overhead resistance at $0.42 on Jan. 23. This indicates that every minor fall is being purchased.
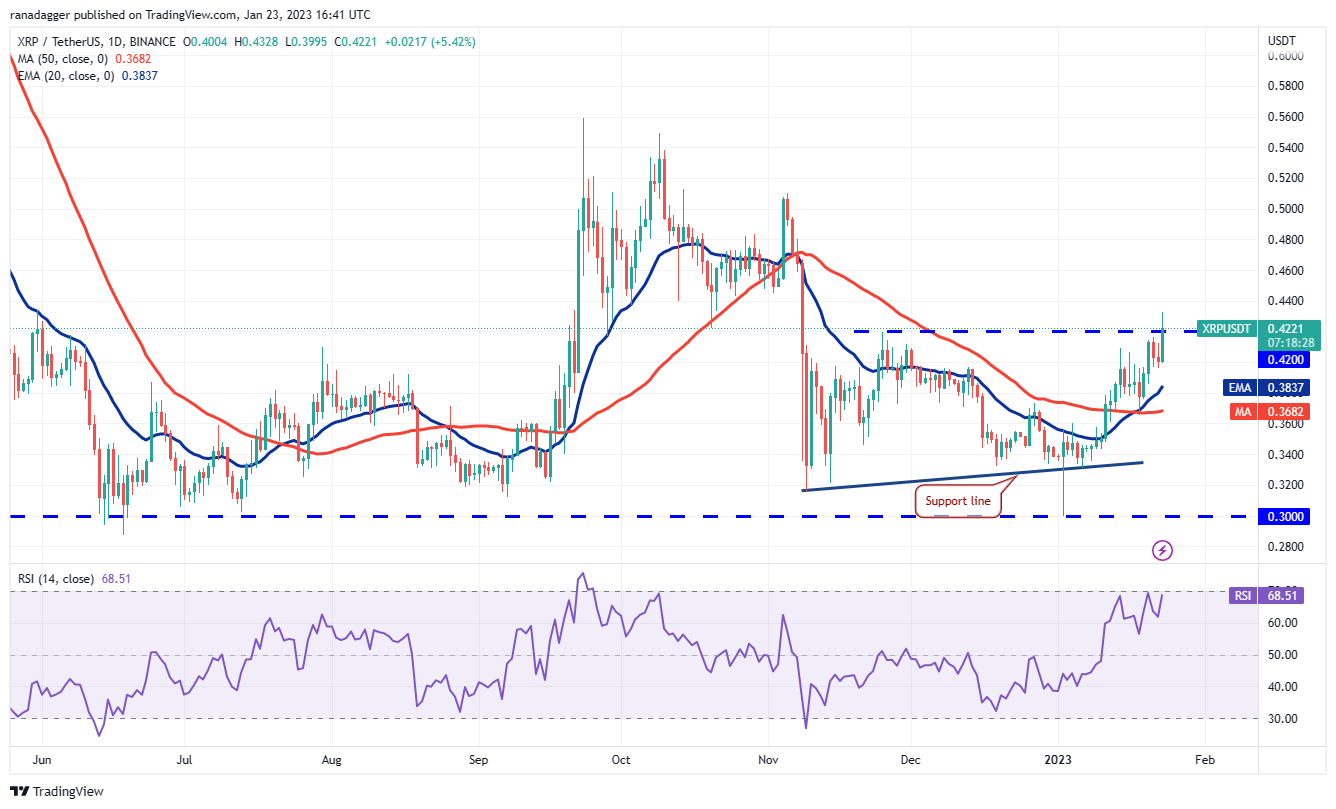
The 20-day EMA ($0.38) is sloping up and the RSI is near the overbought region, indicating that bulls are in command. However, the bears may not surrender easily and will try to defend the $0.42 level with all their might because if this level gives way, the XRP/USDT pair could quickly jump to $0.51.
If the price fails to sustain above $0.42, the bears will try to pull the pair below $0.39. If that happens, the possibility of a break below the 20-day EMA increases.
DOGE/USDT
Dogecoin (DOGE) continues to face selling above $0.09 but the bulls are not willing to abandon their effort.
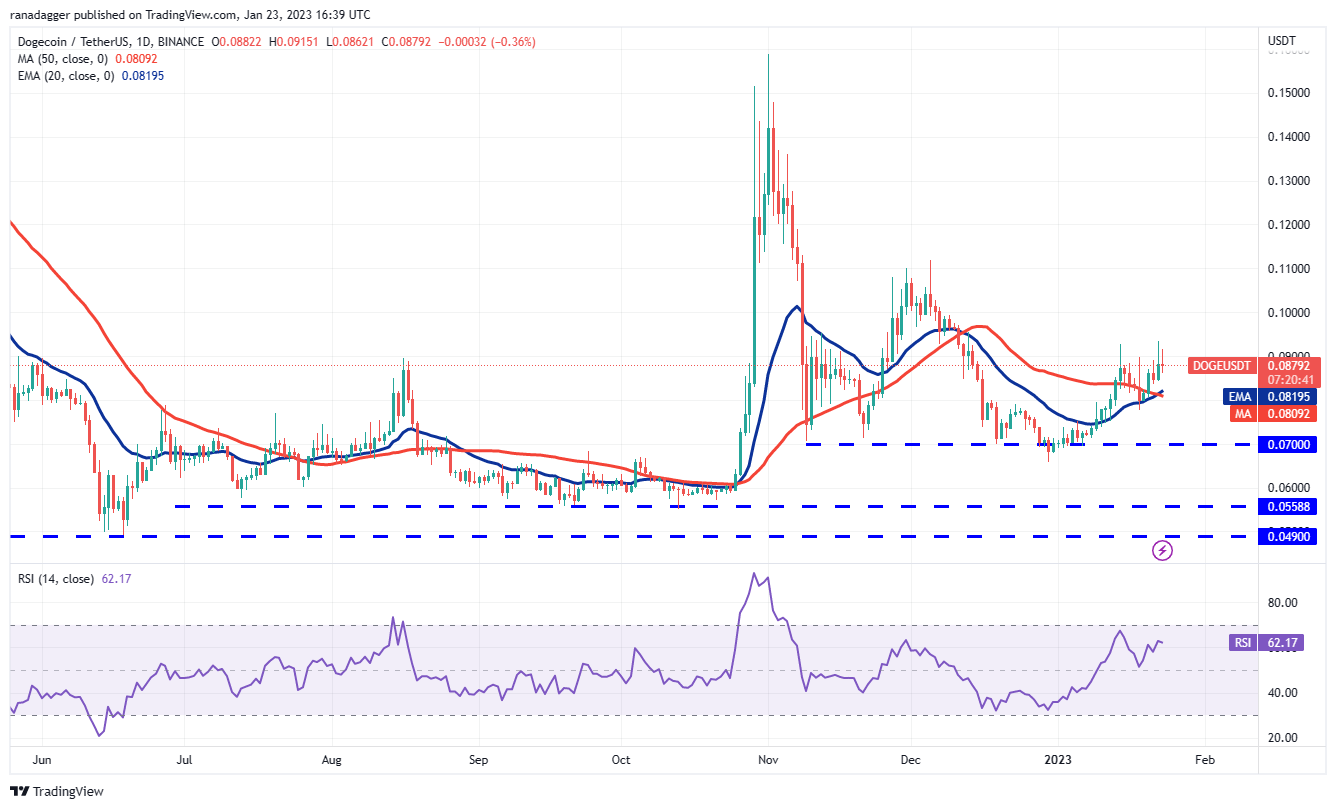
The moving averages have completed a bullish crossover and the RSI is in the positive territory, indicating advantage to buyers. If the price sustains above $0.09, the DOGE/USDT pair could surge to $0.11. This level may act as a formidable barrier and the bulls may find it difficult to ascend it in the near term.
If the price fails to sustain above $0.09, short-term traders may book profits and that could sink the pair below the moving averages. The pair may then decline to the support near $0.07.
Related: 3 signs Axie Infinity price risks giving up its 135% gains in January
ADA/USDT
Cardano (ADA) continues to move up gradually but the bears are trying to stall the recovery near $0.38. If the price turns down from the current level, it could slump to the 20-day EMA ($0.33).
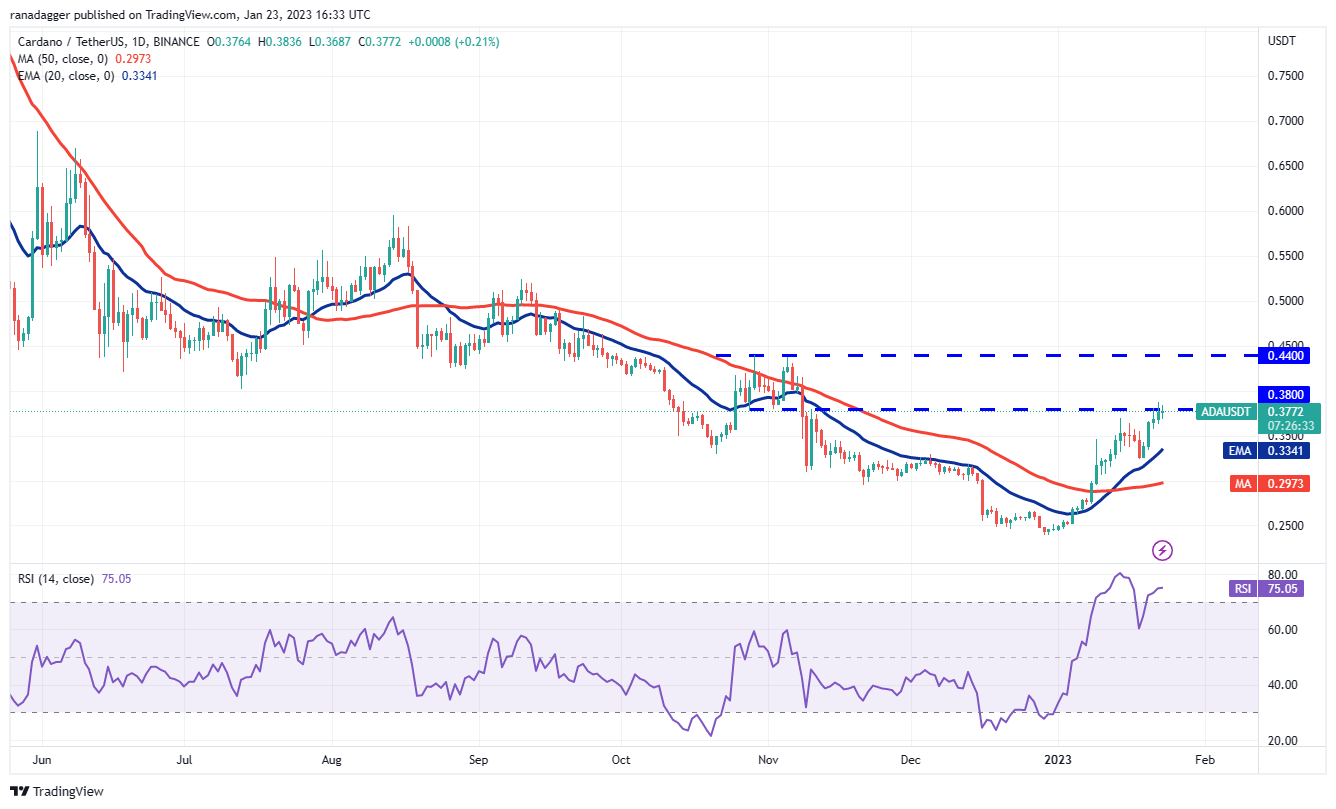
This is an important level to watch out for because a strong rebound off the 20-day EMA will suggest a change in sentiment from selling on rallies to buying on dips. The bulls will then make another attempt to overcome the barrier at $0.38. If they are successful, the ADA/USDT pair could soar to $0.44.
If bears want to gain the upper hand in the near term, they will have to yank the price below the 20-day EMA. The pair could then decline to the 50-day SMA ($0.29).
MATIC/USDT
The bulls tried to propel Polygon (MATIC) above the overhead resistance of $1.05 on Jan. 21 but the bears did not budge. Although the bears have successfully defended $1.05 in the past few days, they have not been able to tug the price below the 20-day EMA ($0.93).

The upsloping 20-day EMA and the RSI in the positive zone suggest that bulls have a slight edge. The repeated retest of a resistance level tends to weaken it. If the price turns up from the current level, the prospects of a break above the overhead resistance improve. The MATIC/USDT pair could then jump to $1.16 and thereafter to $1.30.
Contrarily, if the price turns down from the current level, the bears will sense an opportunity and try to drag the pair below the 20-day EMA. If they can pull it off, the pair may remain stuck inside the $0.69 to $1.05 range for a while longer.
DOT/USDT
Polkadot (DOT) formed a Doji candlestick pattern on Jan. 21 and Jan. 22, indicating indecision among the bulls and the bears about the next move.
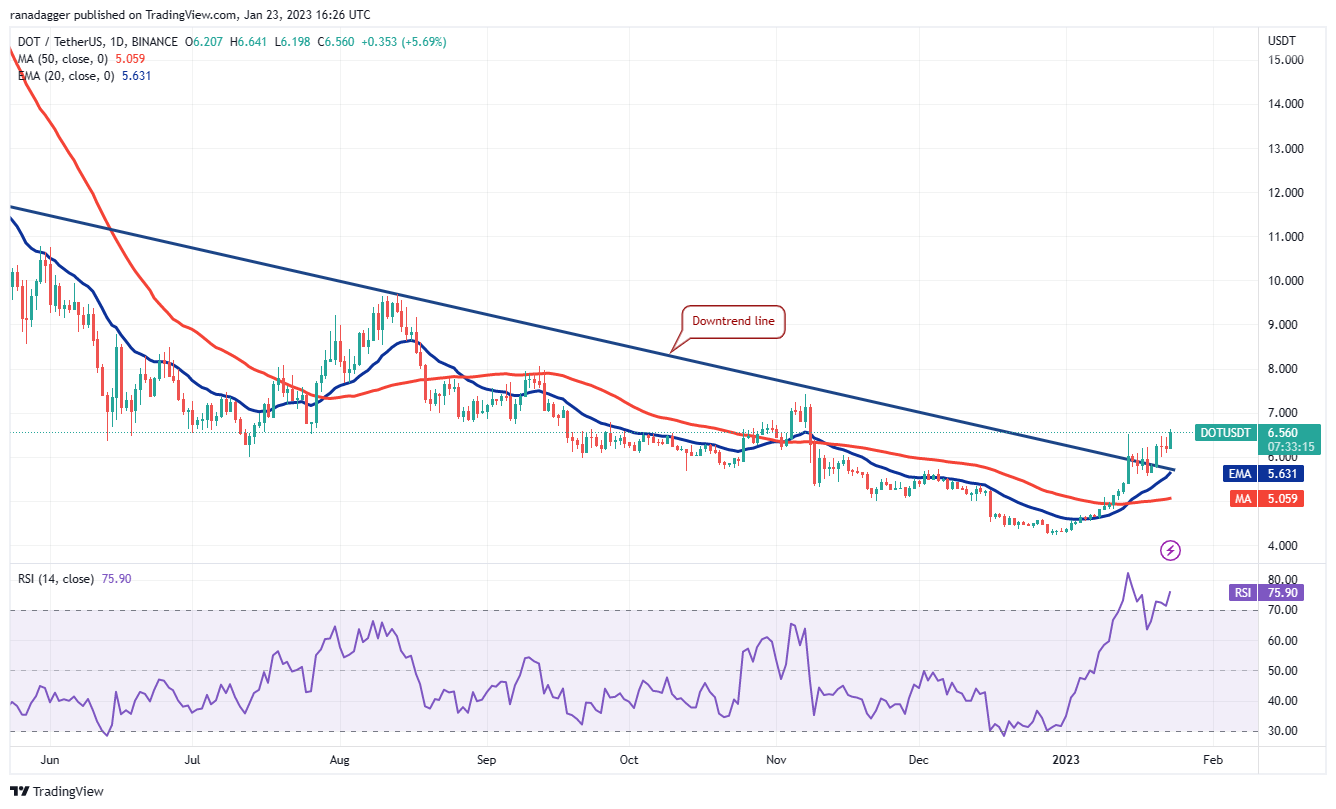
That uncertainty resolved to the upside on Jan. 23 with a break above $6.50. If buyers sustain the price above this level, the DOT/USDT pair could first rise to $7.42 and if this level is taken out, the rally could touch $8. The upsloping moving averages and the RSI in the overbought territory indicate that bulls are in control.
The important level to watch on the downside is the 20-day EMA ($5.63). Sellers will have to sink the price below this support if they want to make a comeback.
The views, thoughts and opinions expressed here are the authors’ alone and do not necessarily reflect or represent the views and opinions of Cointelegraph.
This article does not contain investment advice or recommendations. Every investment and trading move involves risk, and readers should conduct their own research when making a decision.


