Bitcoin vẫn đang vật lộn để duy trì trên 31,000 đô la.
Trong khi sự củng cố chặt chẽ gần ngưỡng kháng cự trên cao là một dấu hiệu tích cực, việc không vượt lên trên nó có thể dẫn đến thanh lý ngắn hạn. Tuy nhiên, một pullback nông không nên được coi là một sự thay đổi xu hướng bởi vì, nhiều lần, phe bò lùi lại một bước để tập hợp lại và khởi động một cuộc tấn công khác tại ngưỡng kháng cự. Nếu rào cản được vượt qua, động lượng tích cực sẽ tăng lên
Giám đốc điều hành Binance Changpeng “CZ” Zhao cho biết trong một phiên “hỏi tôi bất cứ điều gì” trên Twitter rằng Bitcoin (BTC) có thể chứng kiến một năm tăng giá sau khi giảm một nửa vào năm 2024. CZ nói thêm rằng bước đột phá của BlackRock vào tiền điện tử sẽ “cực kỳ có lợi” cho ngành công nghiệp.

Giám đốc điều hành BlackRock Larry Fink đã đưa ra những nhận xét tích cực về Bitcoin trong khi phát biểu trong một cuộc phỏng vấn với Fox Business vào ngày 5 tháng 7. Fink nói rằng Bitcoin là một “tài sản quốc tế không dựa trên bất kỳ loại tiền tệ nào” và các nhà đầu tư có thể sử dụng nó như một hàng rào chống lại lạm phát hoặc mất giá tiền tệ
bình luận tích cực từ Fink có thể hoạt động như một sàn trong quá trình pullback không? Các mức kháng cự trên cao quan trọng trong Bitcoin và altcoin cần được vượt qua để báo hiệu sự bắt đầu của một động thái tăng ngắn hạn là gì? Hãy cùng nghiên cứu biểu đồ của 10 loại tiền điện tử hàng đầu để tìm hiểu.
Phân tích giá Bitcoin
Bitcoin một lần nữa tăng trên 31.000 đô la vào ngày 6 tháng 7, nhưng cuộc biểu tình đã gặp phải áp lực bán mạnh mẽ từ phe gấu. Điều đó đã kéo giá xuống mức trung bình động theo cấp số nhân (EMA) 20 ngày

Một dấu hiệu tích cực có lợi cho phe bò là cặp BTC/USDT đã phục hồi khỏi đường EMA 20 ngày. Điều này cho thấy một tâm lý tích cực khi các nhà giao dịch đang xem những đợt giảm nhỏ như một cơ hội mua. Điều đó nâng cao triển vọng của một đợt phục hồi trên vùng kháng cự $31,000 đến $31,500
If that happens, the pair could start an upward march to $40,000. The bears will attempt to stall the up move at $32,400, but the buyers are expected to bulldoze their way through.
Ngược lại, nếu giá giảm xuống và phá vỡ dưới đường EMA 20 ngày, điều đó sẽ gợi ý rằng phe gấu chiếm thế thượng phong. Sau đó, cặp tiền này có thể giảm xuống đường trung bình động đơn giản 50 ngày (SMA)
Phân tích giá Ether
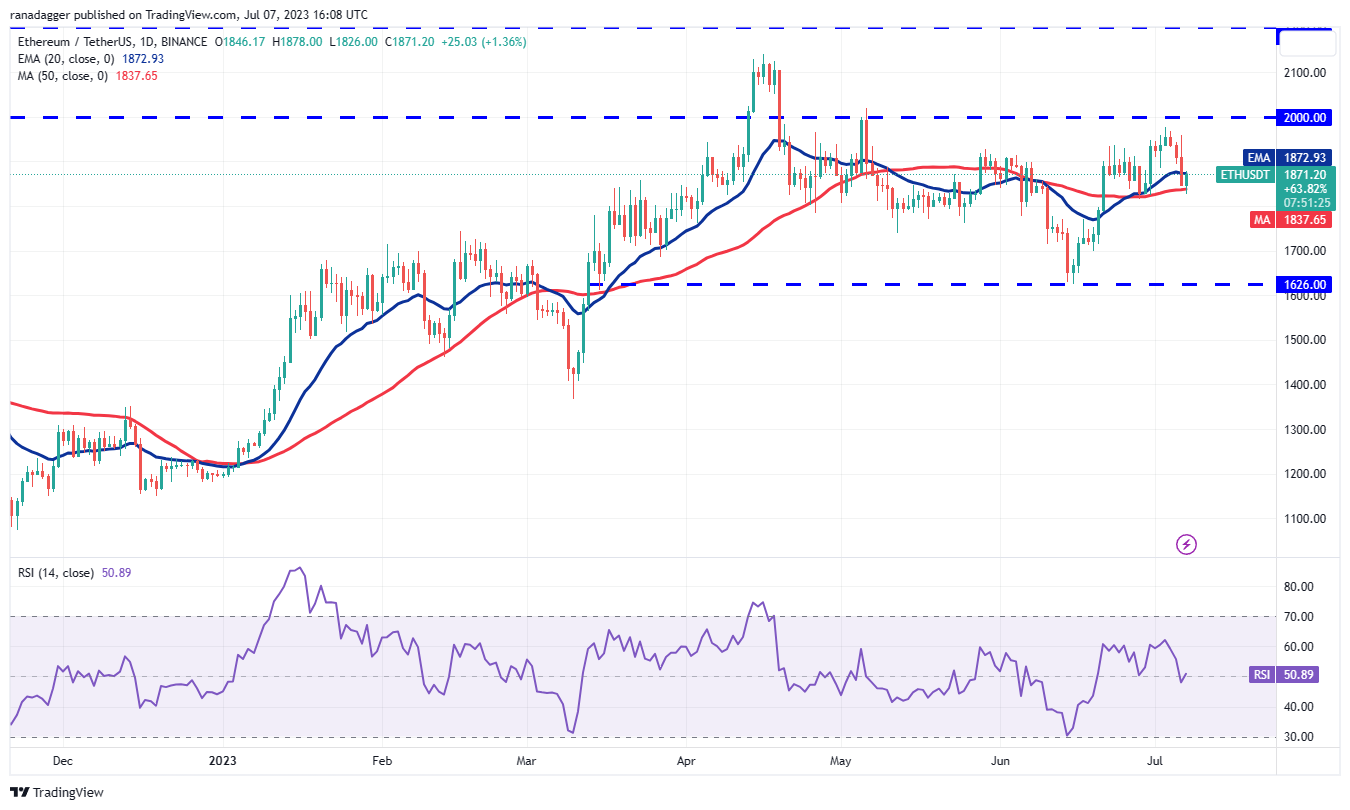
Bấc dài trên nến ngày 6 tháng 7 của Ether (ETH) cho thấy phe gấu đang tích cực bảo vệ ngưỡng kháng cự tâm lý ở mức 2,000 đô la.

Cả hai đường trung bình động đều bị san phẳng và chỉ số sức mạnh tương đối (RSI) gần điểm giữa, cho thấy sự cân bằng giữa cung và cầu. Nếu phe gấu giảm giá xuống dưới đường SMA 50 ngày (1.837 USD), lợi thế ngắn hạn sẽ nghiêng về phía phe gấu. Cặp ETH/USDT sau đó có thể giảm xuống mức $1,626
Ngược lại, nếu giá tăng từ mức hiện tại và duy trì trên đường EMA 20 ngày (1.872 đô la), nó sẽ gợi ý mua mạnh tại SMA 50 ngày. Phe bò sau đó sẽ một lần nữa cố gắng đẩy giá lên trên 2.000 đô la
BNB price analysis
BNB (BNB) đã được củng cố từ $257 đến $220 trong vài ngày qua. Điều này cho thấy phe gấu đang sử dụng các cuộc biểu tình cứu trợ để bán trong khi phe bò đang mua mức

The downsloping 20-day EMA ($242) and the RSI in the negative territory indicate that bears have an edge. Sellers will try to drag the price to the crucial support at $220. The bulls are expected to defend this level with vigor.
Ở phía tăng điểm, phe bò sẽ phải đẩy giá lên trên $257 để gợi ý sự bắt đầu của một sự phục hồi bền vững. Mức $265 có thể hoạt động như một rào cản, nhưng nó có khả năng bị vượt qua. Cặp tiền này sau đó có thể tăng lên 280 đô la
XRP price analysis
XRP (XRP) has been trading between the 20-day EMA ($0.48) and the horizontal support at $0.45 for the past few days. This shows that the bears are selling on rallies, but supply is being lapped up at lower levels.

This tight-range trading is unlikely to continue for long and may result in a breakout. If the support at $0.45 gives way, the bears will try to build upon this advantage and tug the price to the next strong support at $0.41.
Alternatively, if the price turns up from the current level, the bulls will try to overcome the obstacle at the moving averages. If they manage to do that, the XRP/USDT pair could start its march toward $0.56.
Cardano price analysis
Cardano (ADA) has been trading between $0.30 and $0.24 for the past few days. Generally, inside a range, traders buy near the support and sell close to the resistance.

Traders did just that in the ADA/USDT pair and sold at $0.30. The bulls are attempting to arrest the decline at the uptrend line. If the price turns up from the current level or the uptrend line, the bulls will once again endeavor to clear the overhead hurdle at $0.30.
If they succeed, the pair may start an up move to $0.38. The 50-day SMA ($0.31) may act as a barrier, but it is likely to be crossed.
Contrarily, a break below the uptrend line could open the doors for a potential drop to the support at $0.25.
Dogecoin price analysis
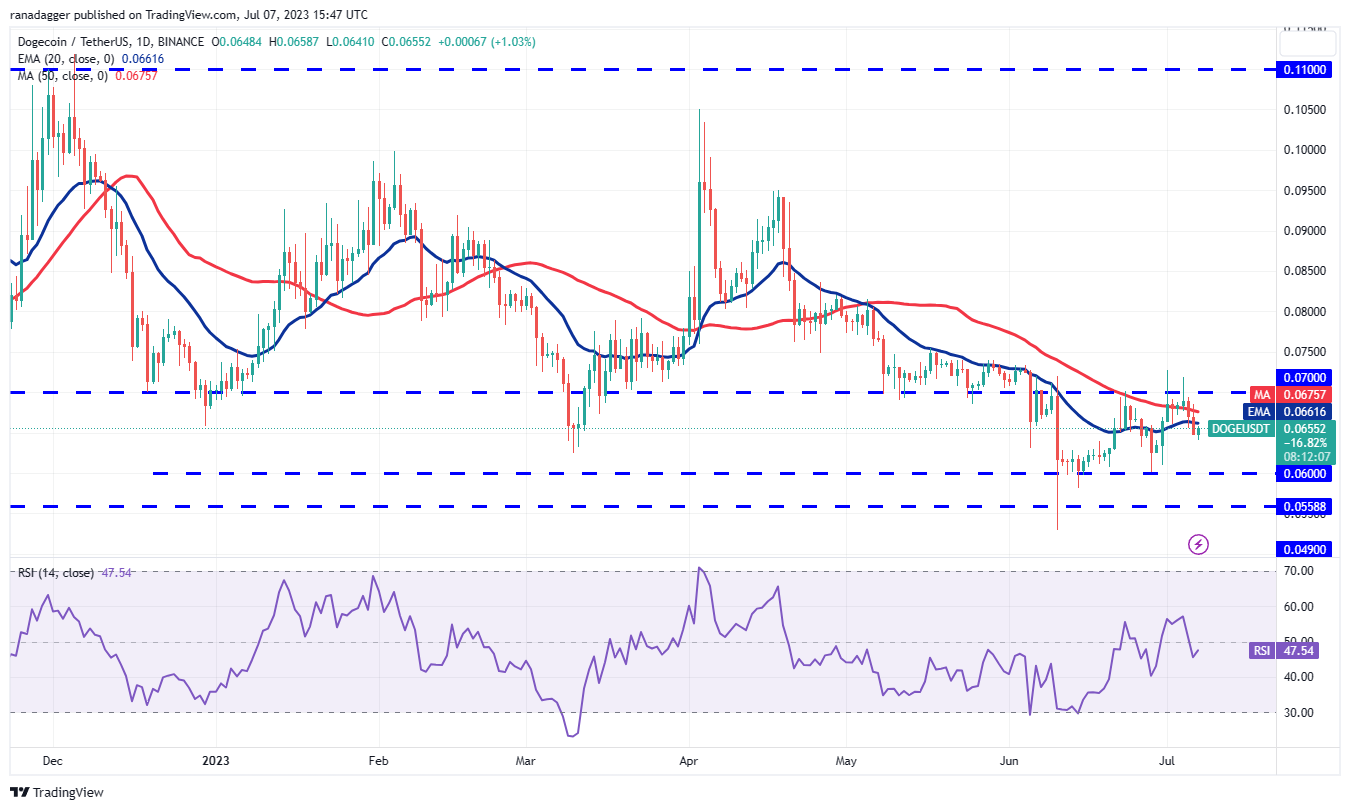
The failure to propel Dogecoin (DOGE) above the overhead resistance of $0.07 on July 4 may have attracted profit-booking from the short-term bulls.

That pulled the price below the moving averages, signaling that the DOGE/USDT pair could remain stuck inside the $0.07 to $0.06 range for a few more days. The flattish 20-day EMA ($0.07) and the RSI just below the midpoint also suggest a range-bound action.
The bulls will have to push and sustain the price above the overhead resistance of $0.07 to seize control. That could pave the way for a rally to $0.08 and then to $0.10. On the downside, a break below $0.06 could resume the down move. The pair may then slump to $0.05.
Solana price analysis
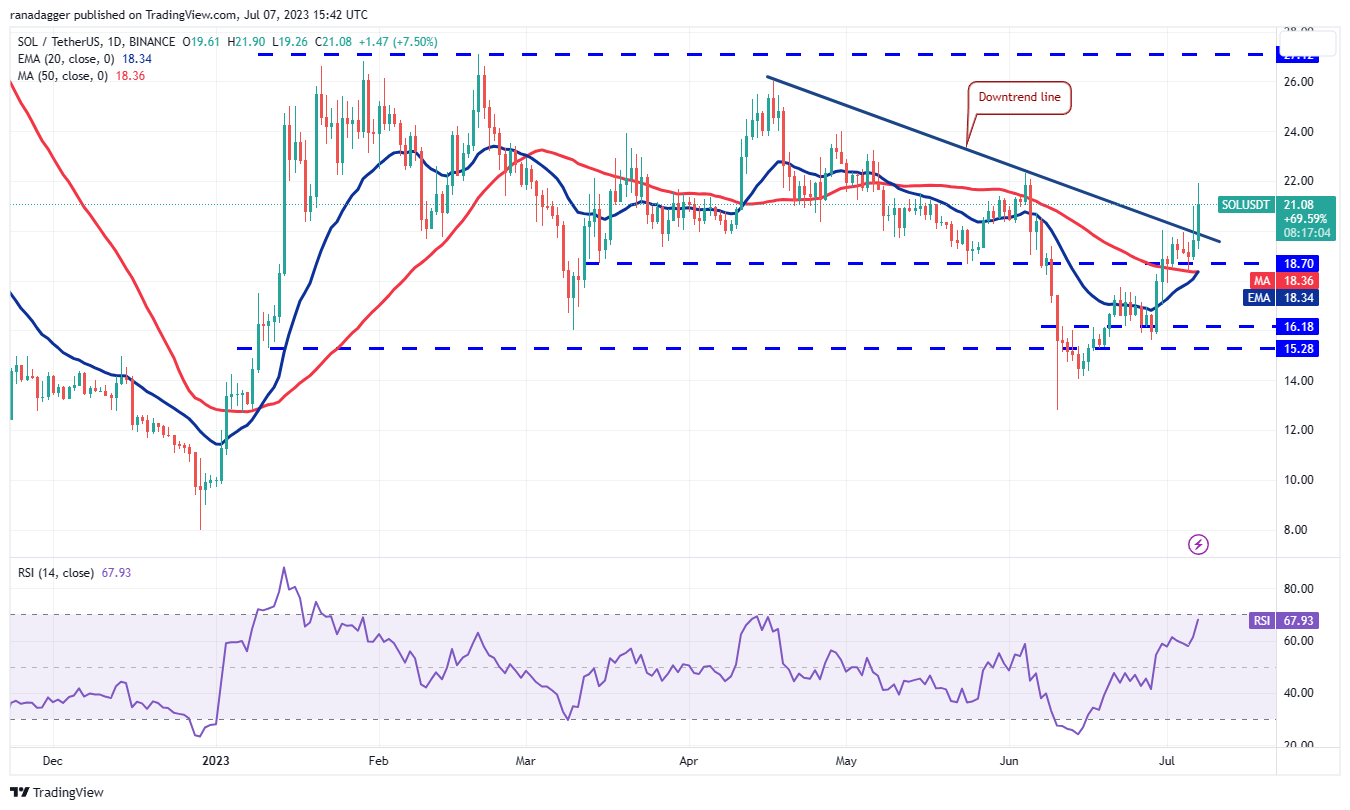
Solana (SOL) bounced off the 50-day SMA ($18.34) on July 5, indicating that every minor dip is being purchased. The bulls have pushed the price above the downtrend line, indicating that the short-term corrective phase may be ending.

The moving averages are about to complete a bullish crossover, and the RSI is near the overbought territory. This shows that the bulls are in command. If buyers sustain the price above the downtrend line, the SOL/USDT pair may climb to $24. Such a move will indicate that the pair is range-bound between $15.28 and $27.12.
If bears want to gain the upper hand, they will have to yank the price below the moving averages. That may catch the aggressive bulls off guard, resulting in a drop to the strong support zone between $16.18 and $15.28.
Related: AI has potential to send Bitcoin price over $750K — Arthur Hayes
Litecoin price analysis
The bulls tried to push Litecoin (LTC) above the overhead resistance of $106 on July 5 and 6, but the long wick on the candlesticks shows that the bears fiercely defended the level.

The LTC/USDT pair plunged to the 20-day EMA ($94), which is an important support level to watch out for. If the price bounces off the current level, the bulls will make one more attempt to clear the overhead hurdle at $106.
However, the bears are likely to have other plans. They will try to sell the rallies and sink the pair below the 20-day EMA. If they do that, the selling may intensify and the pair may further slide to the 50-day SMA ($89).
Polygon price analysis
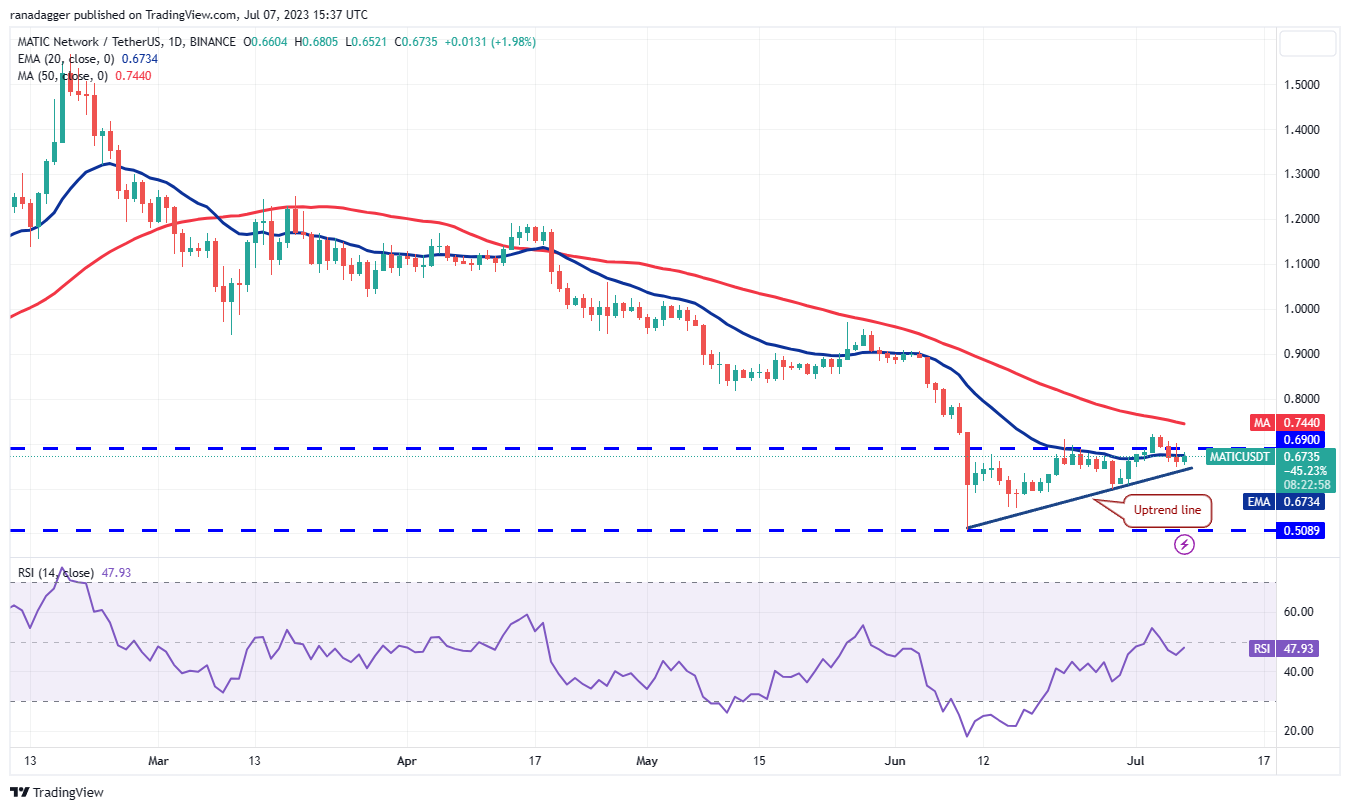
Polygon (MATIC) slipped and closed below the 20-day EMA ($0.67) on July 6, suggesting that the bears are active at higher levels.

The bears will try to trap the aggressive bulls by pulling the price below the uptrend line. If they manage to do that, the ascending triangle pattern will invalidate. That could trigger the stops of several short-term bulls. The MATIC/USDT pair may then slide to $0.60 and subsequently to $0.55.
Contrary to this assumption, if the price rebounds off the uptrend line, the bulls will again try to resume the up move. A break and close above the 50-day SMA ($0.74) could start the journey toward the pattern target of $0.88.
Polkadot price analysis
The long wick on Polkadot’s (DOT) July 6 candlestick shows that the bears are selling on intraday rallies. The price plunged below the moving averages, but the bulls are trying to arrest the decline.

Both moving averages have flattened out, and the RSI is near the midpoint. This indicates a balance between supply and demand. The DOT/USDT pair may oscillate between $4.74 and $5.64 for a few days.
The first sign of strength will be a break and close above $5.15. That will indicate solid demand at lower levels. The bulls will then again try to push the pair to $5.64. On the downside, a break below $4.74 could tilt the advantage in favor of the bears.
This article does not contain investment advice or recommendations. Every investment and trading move involves risk, and readers should conduct their own research when making a decision.
This article is for general information purposes and is not intended to be and should not be taken as legal or investment advice. The views, thoughts, and opinions expressed here are the author’s alone and do not necessarily reflect or represent the views and opinions of Cointelegraph.


