


Bitcoin dẫn đầu thị trường tiền điện tử cao hơn vào ngày 29 tháng 8 sau chiến thắng của Grayscale trong vụ kiện chống lại Ủy ban Chứng khoán và Giao dịch Hoa Kỳ. Tuy nhiên, sự phục hồi không thể được duy trì, vì các nhà phân tích cảnh báo rằng chiến thắng không đảm bảo sự chấp thuận của một quỹ giao dịch trao đổi Bitcoin (BTC) giao ngay.
Tuy nhiên, chiến thắng có thể chứng tỏ là lạc quan đối với Grayscale. Các nhà phân tích Glassnode cho biết trong một bài đăng trên X (trước đây là Twitter) vào ngày 30 tháng 8 rằng Grayscale Bitcoin Trust (GBTC) có thể trở lại mức cao vào năm tới. Điều quan trọng cần lưu ý là GBTC đã giao dịch với mức chiết khấu so với giá Bitcoin giao ngay trong hai năm rưỡi qua

Trong ngắn hạn, mặc dù Chỉ số S&P 500 đang trên đà phục hồi và Chỉ số Đô la Mỹ đã giảm trong thời gian tới, thị trường tiền điện tử không thể duy trì các mức cao hơn. Điều này cho thấy rằng các nhà giao dịch đã duy trì sự tập trung của họ vào tin tức cụ thể về tiền điện tử
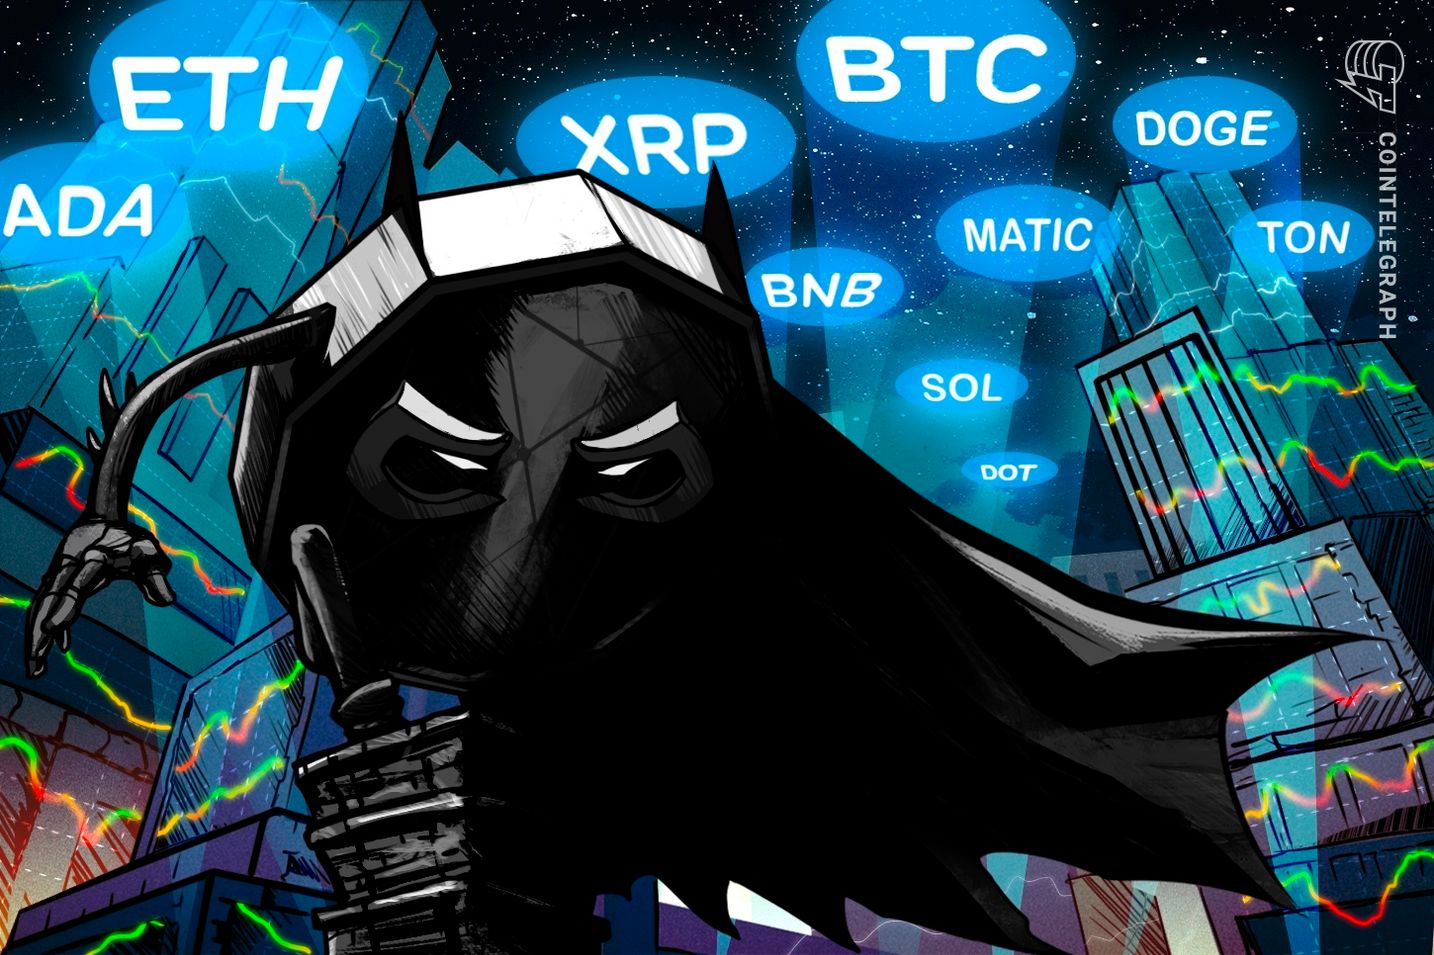
Liệu những con bò đực có thể bảo vệ các mức hỗ trợ trong Bitcoin và altcoin không? Điều đó sẽ sớm dẫn đến sự phục hồi mạnh mẽ hơn? Hãy cùng nghiên cứu biểu đồ của 10 loại tiền điện tử hàng đầu để tìm hiểu.
Phân tích giá Bitcoin
Phạm vi của Bitcoin đã được giải quyết theo hướng tăng với một sự bứt phá mạnh vào ngày 29 tháng 8. Động thái này cho thấy giá có khả năng dao động trong phạm vi lớn giữa $24,800 và $31,000

Đường trung bình động hàm mũ (EMA) 20 ngày là 27.168 đô la đang đi ngang và chỉ số sức mạnh tương đối (RSI) nằm ngay dưới điểm giữa, cho thấy áp lực bán đang giảm.
Người mua sẽ cố gắng bảo vệ mức đột phá $26,833. Nếu họ thành công, nó sẽ báo hiệu rằng phe bò đã chuyển mức này thành hỗ trợ. Cặp BTC/USDT trước tiên có thể tăng lên đường trung bình động đơn giản (SMA) 50 ngày là 28,689 đô la và
Nếu những con gấu muốn bẫy những con bò đực hung hãn, chúng sẽ phải kéo giá xuống dưới 26.833 USD. Nếu họ làm điều đó, nó sẽ chỉ ra rằng những con gấu đang bán trên mọi nỗ lực phục hồi. Cặp tiền này sau đó có thể kiểm tra lại mức hỗ trợ mạnh ở mức 24,800 USD
Phân tích giá Ether
Ether (ETH) một lần nữa phục hồi khỏi ngưỡng hỗ trợ quan trọng tại $1,626 vào ngày 28 tháng 8, cho thấy rằng phe bò đang mua mức giảm.

Động lượng tăng lên vào ngày 29 tháng 8 và phe bò đẩy giá lên trên đường EMA 20 ngày (1.716 USD). Điều này cho thấy cặp ETH/USDT có thể dao động trong khoảng $1,626 đến 1,816 đô la trong một thời gian nữa
Giá đã quay trở lại dưới đường EMA 20 ngày vào ngày 30 tháng 8, báo hiệu rằng những con gấu vẫn chưa từ bỏ. Nếu giá duy trì dưới đường EMA 20 ngày, cặp tiền có thể giảm xuống còn 1,626 USD. Ngược lại, nếu giá tăng lên và leo trở lại trên đường EMA 20 ngày, cặp tiền này có thể chạm ngưỡng kháng cự trên $1,816
Phân tích giá BNB
Sau khi giao dịch trong phạm vi hẹp gần 220 đô la trong vài ngày, BNB (B NB) đã tăng cao hơn vào ngày 29 tháng 8. Sự phục hồi cứu trợ đang đối mặt với ngưỡng kháng cự tại SMA 50 ngày (235 đô la) như được nhìn thấy từ bấc dài trên nến trong ngày

Đường EMA 20 ngày ($224) đang đi ngang và chỉ báo RSI nằm ngay dưới điểm giữa, cho thấy áp lực bán giảm đang giảm. Nếu giá tăng từ mức hiện tại, cặp BNB/USDT có thể tăng lên đường kháng cự. Mức này một lần nữa có thể thu hút sự bán mạnh mẽ của phe gấu.
Mặt khác, nếu giá trượt xuống dưới 220 đô la, nó sẽ chỉ ra rằng phe gấu vẫn kiểm soát được. Cặp tiền này sau đó có thể giảm xuống mức thấp nhất trong ngày 22 tháng 8 là 203 đô la.
Phân tích giá XRP
XRP (XRP) has been trading between $0.50 and $0.56 for the past few days. This suggests that the bulls are buying near the support and the bears are selling close to the resistance.

The downsloping 20-day EMA ($0.55) and the RSI in the negative territory indicate that the bears have the upper hand. Sellers will try to sink the price below the strong support at $0.50. If they manage to do that, the XRP/USDT pair may plummet to $0.41.
Alternatively, if the price rebounds off $0.50, the pair may extend its stay inside the tight range for some more time. Buyers will have to shove and sustain the price above $0.56 to signal the start of a sustained recovery. The pair may then rise to the 50-day SMA ($0.64).
Cardano price analysis
The bulls pushed Cardano (ADA) above $0.28 on Aug. 29, but they could not sustain the higher levels. That kept the price below the resistance at $0.28.

This shows that the price remains stuck inside the range between $0.24 and $0.28. The next support is at the uptrend line. If the price rebounds off this level with strength, it will suggest that every minor dip is being purchased. That will enhance the prospects of a rally above $0.28. Above this level, the ADA/USDT pair could soar to $0.32.
Instead, if the price dives below the uptrend line, it will signal that the bears are trying to make a comeback. The pair could then skid to the vital support at $0.24.
Dogecoin price analysis
Dogecoin (DOGE) reached the 20-day EMA ($0.07) on Aug. 29, but the bulls are struggling to sustain the price above it.

If the price turns down sharply from the current level, it will suggest that bears are selling on rallies. The DOGE/USDT pair may then consolidate between the 20-day EMA and the support at $0.06.
Alternatively, if the pair does not give up much ground from the current level, it will suggest that the bulls are maintaining their buying pressure. That could open the gates for a potential rally to $0.08.
Solana price analysis
Solana’s (SOL) recovery hit a roadblock at the 20-day EMA ($21.77) on Aug. 29, indicating that the sentiment remains negative and traders are selling on rallies.

The bears will once again try to tug the price to $19.35. If this level cracks, the SOL/USDT pair could start a downward move to $18 and then to $16.
The bulls are likely to have other plans. They will try to build upon the recovery by pushing the price above the overhead resistance at $22.30. If they can pull it off, the pair may rise to the 50-day SMA ($23.59). If the price turns down from this level, the pair may remain range-bound between the 50-day SMA and $19.35 for some time.
Related: Why is Dogecoin price up today?
Toncoin price analysis
Toncoin (TON) soared above the neckline of the inverse head-and-shoulders pattern at $1.53 on Aug. 29. This signals a potential trend change.

Typically, after a breakout, the price turns down and retests the breakout level. If the price bounces off $1.53, it will suggest that the bulls have flipped the level into support. That could start an up move toward the pattern target of $1.91. If this resistance is scaled, the TON/USDT pair could reach $2.07.
If the bears want to prevent the rally, they will have to quickly sink the price back below $1.53. Such a move could trap the aggressive bulls, resulting in a long liquidation. The pair may then slump to $1.25.
Polkadot price analysis
Polkadot (DOT) broke and closed above the 20-day EMA ($4.64) on Aug. 29, but the long wick on the candlestick shows selling at higher levels.

The bears pulled the price back below the 20-day EMA on Aug. 30. This indicates that the bears have not given up and are viewing the recoveries as a selling opportunity. The flattening 20-day EMA and the RSI in the negative territory signal possible range-bound action in the near term.
If the price breaks below $4.50, the DOT/USDT pair may swing between the 20-day EMA and $4.22 for some time. On the other hand, a break and close above the 20-day EMA could propel the pair to the overhead resistance at $5.
Polygon price analysis
Polygon (MATIC) is facing stiff resistance in the zone between $0.60 and $0.65 as seen from the long wick on the Aug. 29 candlestick.

The price turned down on Aug. 30, suggesting that the MATIC/USDT pair could consolidate in a large range between $0.51 and $0.65 for a while. The price action inside the range is likely to remain random and volatile.
If bears want to seize control, they will have to drag the price below $0.51. That could resume the downtrend with the next support at $0.45. On the upside, a break and close above the 50-day SMA ($0.67) could signal that the bulls are in the driver’s seat.
This article does not contain investment advice or recommendations. Every investment and trading move involves risk, and readers should conduct their own research when making a decision.


