Bitcoin (BTC) đang cố gắng giao dịch trên 27.000 đô la, đây là một dấu hiệu tích cực. Trong vài ngày qua, giá Bitcoin đã tăng lên trên 26.000 đô la trong điều kiện bất lợi khi chỉ số đô la Mỹ (DXY) tăng mạnh và chỉ số S&P 500 (SPX) đang lao dốc. Điều này cho thấy rằng việc bán cạn kiệt ở mức thấp hơn.
Quyết định của Ủy ban Chứng khoán và Giao dịch Hoa Kỳ về việc trì hoãn quỹ giao dịch trao đổi Bitcoin giao ngay (ETF) trước thời hạn cũng không làm giảm giá. Điều này cho thấy rằng những người tham gia thị trường đang có cái nhìn dài hạn hơn về Bitcoin. Nhà phân tích James Seyffart của Bloomberg ETF tin rằng một quyết định sớm đã được đưa ra bởi cơ quan quản lý vì có nguy cơ chính phủ Mỹ đóng cửa vào ngày 1

Bitcoin’s resilience over the past few days seems to have boosted trader’s sentiment. That helped start a recovery in most major altcoins, which are trying to climb above their respective resistance levels.
Bitcoin có thể mở rộng đà tăng của nó trong thời gian tới và điều đó sẽ bắt đầu sự hồi sinh trong không gian tiền điện tử? Hãy cùng nghiên cứu biểu đồ của 10 loại tiền điện tử hàng đầu để tìm hiểu.
Phân tích giá Bitcoin
Sau khi vật lộn trong vài ngày, phe bò cuối cùng đã đẩy Bitcoin lên trên mức trung bình động vào ngày 28 tháng 9. Phe bò hiện đang cố gắng cản trở những nỗ lực của phe gấu để đẩy giá trở lại dưới mức trung bình động theo cấp số nhân 20 ngày (26,534 đô la

Các đường trung bình động đang trên bờ vực của sự giao nhau tăng giá và chỉ số sức mạnh tương đối (RSI) nằm trong vùng tích cực, cho thấy rằng con đường kháng cự ít nhất là đi lên. Có một ngưỡng kháng cự nhỏ ở mức $27,500 nhưng nó có khả năng bị vượt
Cặp BTC/USDT sau đó có thể tăng lên mức kháng cự trên $28,143. Mức này một lần nữa có khả năng chứng kiến một trận chiến khó khăn giữa những con bò đực và những con gấu.
Mặt khác, mức 26.000 đô la là một mức quan trọng cần chú ý. Nếu mức này nhường chỗ, lợi thế sẽ nghiêng về phía gấu. Cặp tiền này sau đó có thể giảm xuống mức hỗ trợ đáng gờm ở mức 24,800 đô la
Ether price analysis
Ether (ETH) đã tăng và đóng cửa trên đường EMA 20 ngày (1.622 USD) vào ngày 28 tháng 9, cho thấy áp lực bán đang giảm. Người mua tiếp tục mua và vượt qua rào cản tại đường trung bình động đơn giản 50 ngày (1.660 đô la)

Phe bò sẽ cố gắng đẩy giá lên mức kháng cự trên $1,746. Đây là mức quan trọng cần theo dõi vì nếu người mua vượt qua rào cản này, cặp ETH/USDT sẽ hoàn thành mô hình đáy kép. Thiết lập đảo chiều này có mục tiêu mục tiêu là $1,961
Ngược lại, nếu giá giảm từ $1,746, nó sẽ chỉ ra rằng phe gấu vẫn là người bán trên các cuộc biểu tình. Giá sau đó có thể giảm xuống đường EMA 20 ngày. Nếu giá phục hồi khỏi ngưỡng hỗ trợ này, nó sẽ nâng cao triển vọng của một đợt tăng trên $1,746. Những con gấu sẽ quay trở lại trò chơi nếu chúng kéo giá trở lại dưới đường EMA 20 ngày
Phân tích giá BNB
BNB (BNB) đã được giao dịch trong phạm vi $220 đến $203 trong vài ngày qua. Phe bò đang cố gắng đẩy giá lên mức kháng cự trên 220 đô la

Đường EMA 20 ngày ($213) đi ngang nhưng chỉ số RSI đã tăng lên thành vùng tích cực, cho thấy động lượng đang chuyển sang có lợi cho phe bò. Nếu mức kháng cự $220 được vượt qua, cặp BNB/USDT có thể tăng lên
Trái ngược với giả định này, nếu giá giảm mạnh từ $220, nó sẽ chỉ ra rằng hành động giới hạn phạm vi có thể tiếp tục trong một thời gian nữa. Chặng tiếp theo của xu hướng giảm sẽ bắt đầu sau khi những con gấu kéo giá xuống dưới $203
Phân tích giá XRP
Người mua đã đẩy XRP (XRP) lên trên đường EMA 20 ngày (0,50 đô la) vào ngày 28 tháng 9 và tiếp theo là di chuyển trên đường kháng cự của mô hình tam giác đối xứng vào ngày 29 tháng 9.

If the price sustains above the triangle, it will signal that the uncertainty has resolved in favor of the buyers. The XRP/USDT pair could then rally to the overhead resistance at $0.56. This is an important resistance to watch out for because a break above it will clear the path for a potential rally to the pattern target of $0.64.
Contrarily, if the price turns down and re-enters the triangle, it will indicate that markets have rejected the higher levels. The bears will then try to gain the edge by pulling the price below the uptrend line of the triangle.
Cardano price analysis
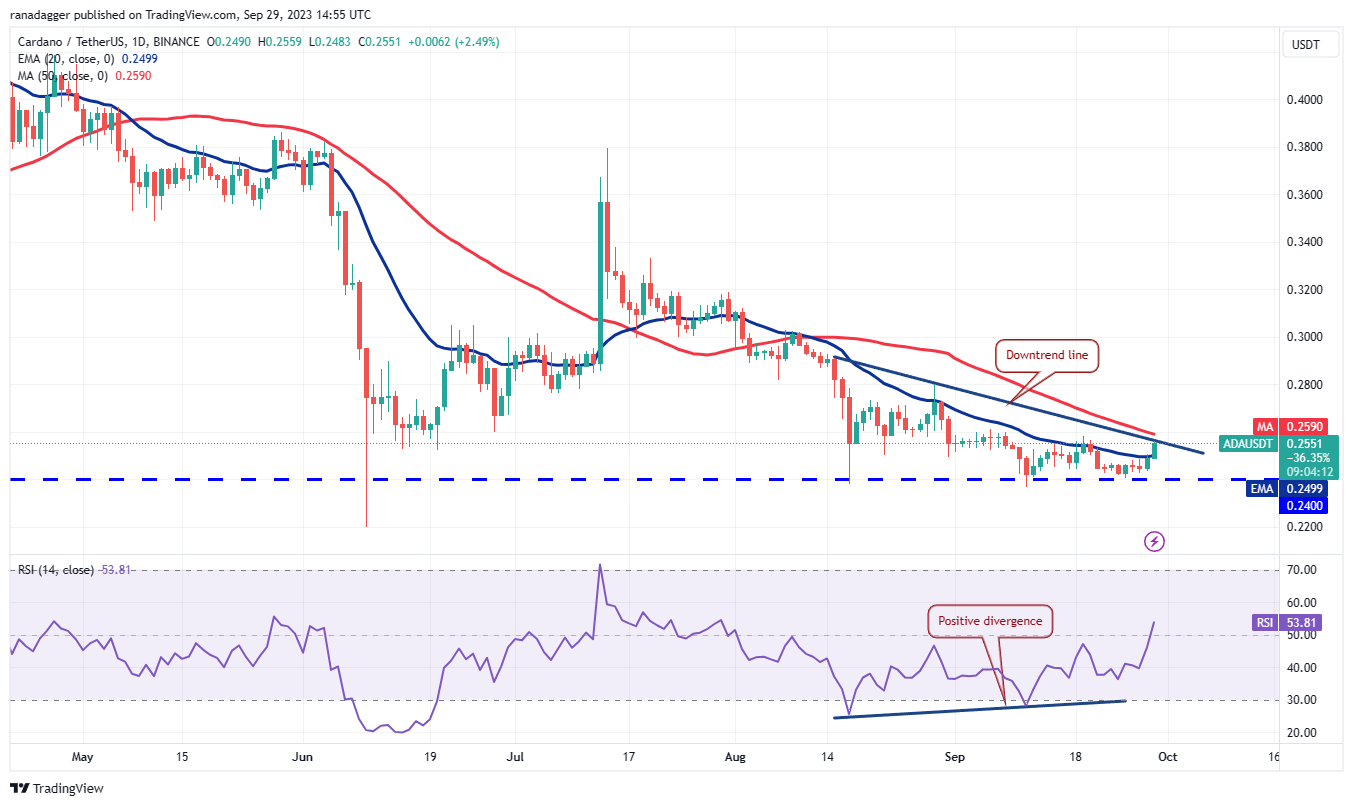
The bulls are trying to sustain Cardano (ADA) above the 20-day EMA ($0.25) on Sep. 29, which shows that the bears are losing their grip.

A break and close above the downtrend line will invalidate the bearish descending triangle pattern. Generally, the failure of a bearish pattern results in a sharp up-move as the sellers rush to exit their shorts and the bulls waiting on the sidelines start buying. That could propel the ADA/USDT pair to $0.29 and subsequently to $0.32.
Time is running out for the bears. If they want to regain control, they will have to defend the downtrend line and pull the price below $0.24. The next support on the downside is at $0.22.
Dogecoin price analysis
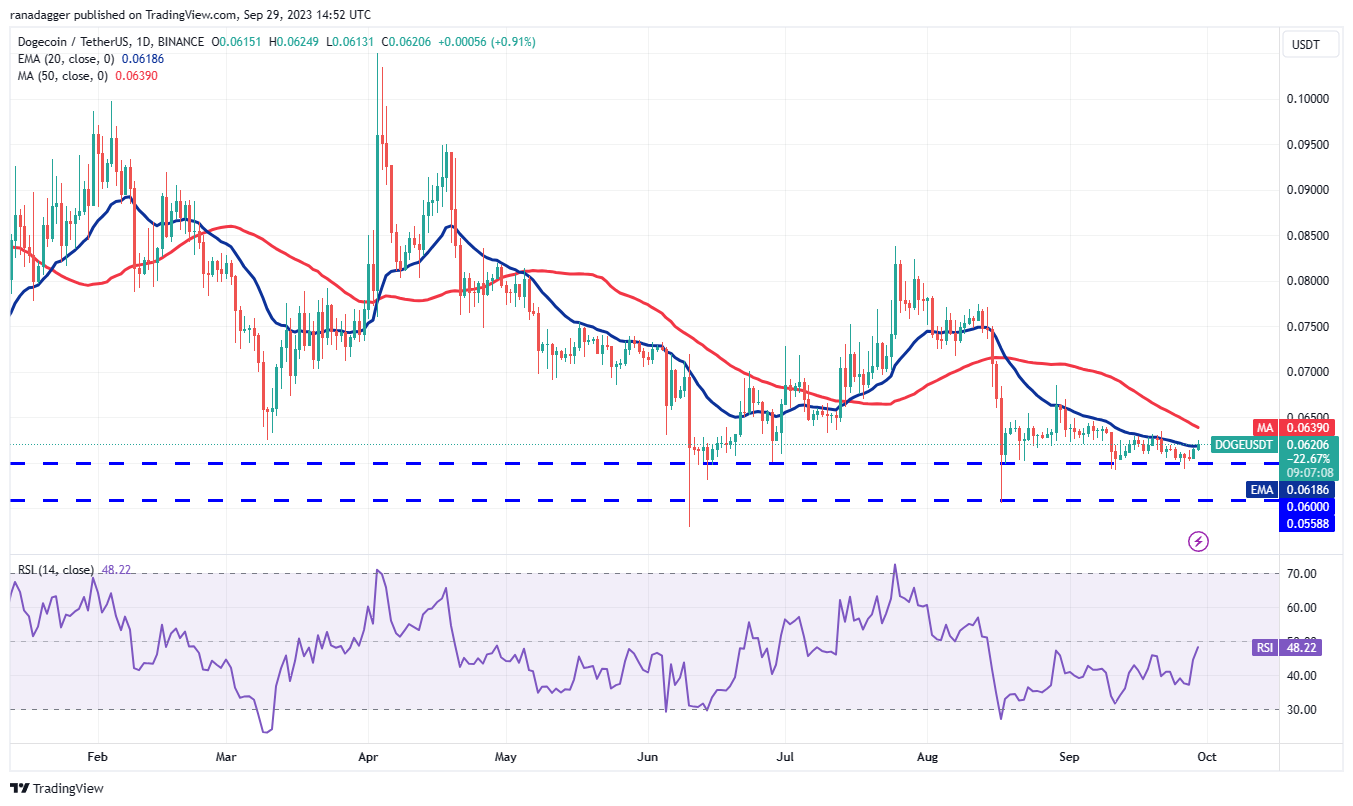
Dogecoin’s (DOGE) range has shrunk in the past few days, increasing the prospect of a range expansion within the next few days.

The 20-day EMA ($0.06) is flattening out and the RSI is just below the midpoint, indicating a balance between supply and demand. If buyers kick the price above the 20-day EMA with force, it will signal the start of a recovery. The DOGE/USDT pair could first rise to $0.07 and thereafter to $0.08.
If bears want to prevent the upside, they will have to quickly drag the price below $0.06. If they do that, the pair may plunge to the next critical support at $0.055.
Solana price analysis
Solana (SOL) remains stuck inside the large range between $27.12 and $14 for the past several days. Trading inside a range can be random and volatile as bulls typically buy at the support and sell near the resistance.

The bulls are trying to start a relief rally, which has reached the 50-day SMA ($20.44). This is an important level to watch out for because a break above it will suggest that the bulls are back in the game. The SOL/USDT pair could then rise to $22.30.
Instead, if the price turns down from the 50-day SMA, it will indicate that the bears are active at higher levels. Sellers will have to tug the price below $18.50 to open the doors for a retest of $17.33.
Related: Why is Ether (ETH) price up today?
Toncoin price analysis
Toncoin (TON) rebounded off the 20-day EMA ($2.13) on Sep. 27, indicating that the sentiment remains positive and traders are buying on dips.

The long wick on the Sep. 27 and 28 candlestick shows that the bears are selling at the 38.2% Fibonacci retracement level of $2.28. However, a positive sign in favor of the bulls is that they have not allowed the price to slip below the 20-day EMA.
Buyers will have to shove the price above the 61.8% Fibonacci retracement level of $2.40 to open the doors for a retest of the stiff overhead resistance at $2.59. This positive view will invalidate if the price turns down and plummets below $2.07.
Polkadot price analysis
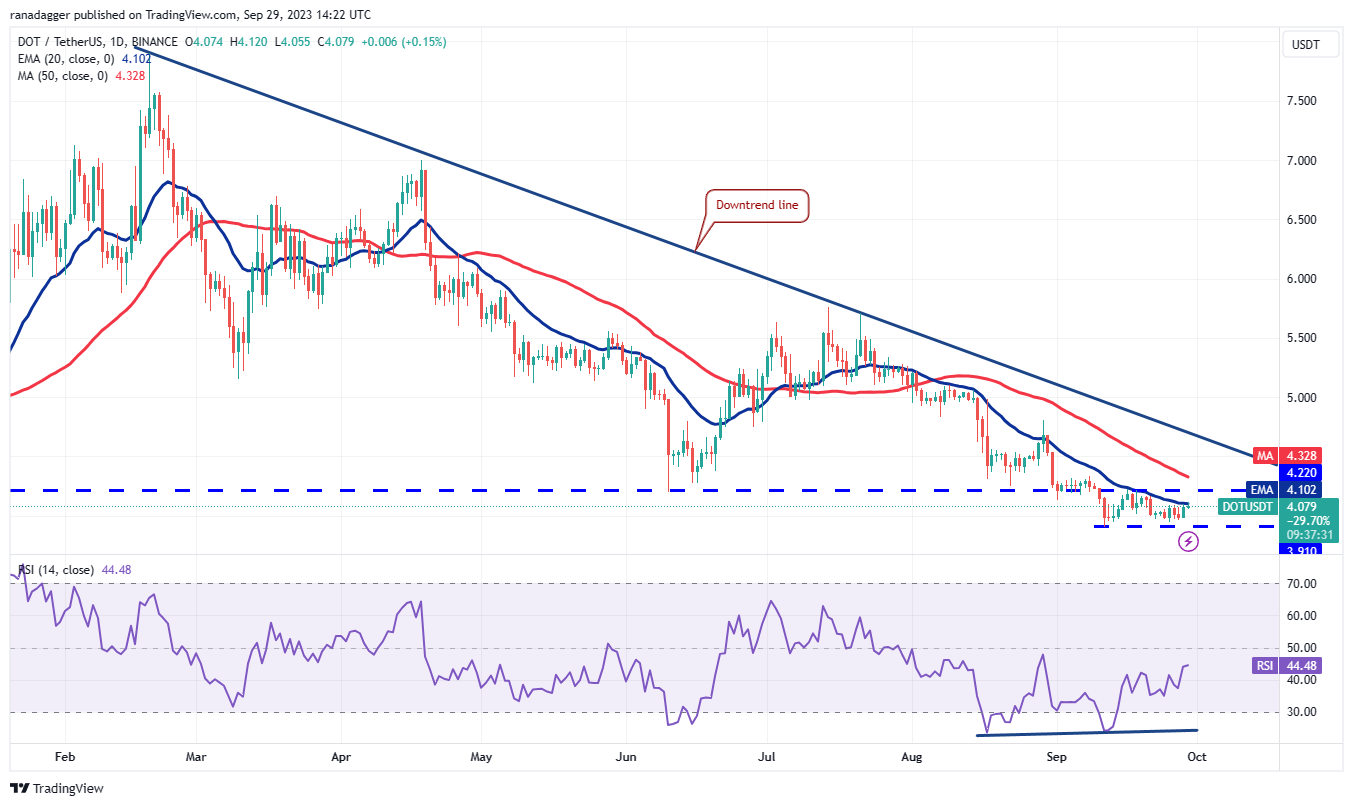
The failure of the bears to sink Polkadot (DOT) below the $3.91 support indicates that the range-bound action remains intact.

Buyers will try to drive the price above the 20-day EMA ($4.10) and challenge the overhead resistance at the 50-day SMA ($4.32). If this level is cleared, the DOT/USDT pair could surge to the downtrend line. The bulls will have to overcome this barrier to signal a potential trend change.
The important support to watch on the downside is $3.91. A break below this level will suggest the resumption of the downtrend toward $3.58.
Polygon price analysis
Polygon (MATIC) turned up from $0.50 on Sep. 28 indicating solid buying at lower levels. The price has reached the 20-day EMA ($0.52), which is an important level to keep an eye on.

The positive divergence on the RSI indicates that the selling pressure is reducing. That enhances the prospects of a break above the moving averages. The MATIC/USDT pair could then retest the overhead resistance at $0.60. The bears are expected to protect this level with vigor.
If bears want to maintain their control, they will have to yank the price below the strong support at $0.49. If this support gives way, the pair may drop to $0.45.
This article does not contain investment advice or recommendations. Every investment and trading move involves risk, and readers should conduct their own research when making a decision.


