Các tin tức và các sự kiện liên quan đến cuộc khủng hoảng ngân hàng ở Hoa Kỳ và châu Âu đã dẫn đến một vòng quay của các quỹ vào các khoản đầu tư được coi là ít rủi ro hơn. Theo Financial Times, các quỹ thị trường tiền tệ Hoa Kỳ vào tháng 3 chứng kiến một dòng chảy 286 tỷ USD.
Cùng với các quỹ thị trường tiền tệ, một phần tiền cũng có thể đã thấm vào ngành công nghiệp mật mã. Nhu cầu tăng có thể là một trong những lý do cho hiệu suất mạnh mẽ của Bitcoin (BTC) trong tháng Ba.
Câu hỏi lớn trong tâm trí của các nhà đầu tư crypto là liệu sự phục hồi sẽ tiếp tục hay nếu đó là thời gian để đặt lợi nhuận trong Bitcoin.
Bitcoin hodlers dường như tự tin vào câu chuyện dài hạn và không bị thu hút vào việc bán cổ phiếu của họ sau đợt tăng giá gần đây. Theo dữ liệu của Glassnode, phần trăm nguồn cung Bitcoin vẫn không hoạt động kể từ tháng 3 năm 2021 đã chạm mức cao mới mọi thời đại.
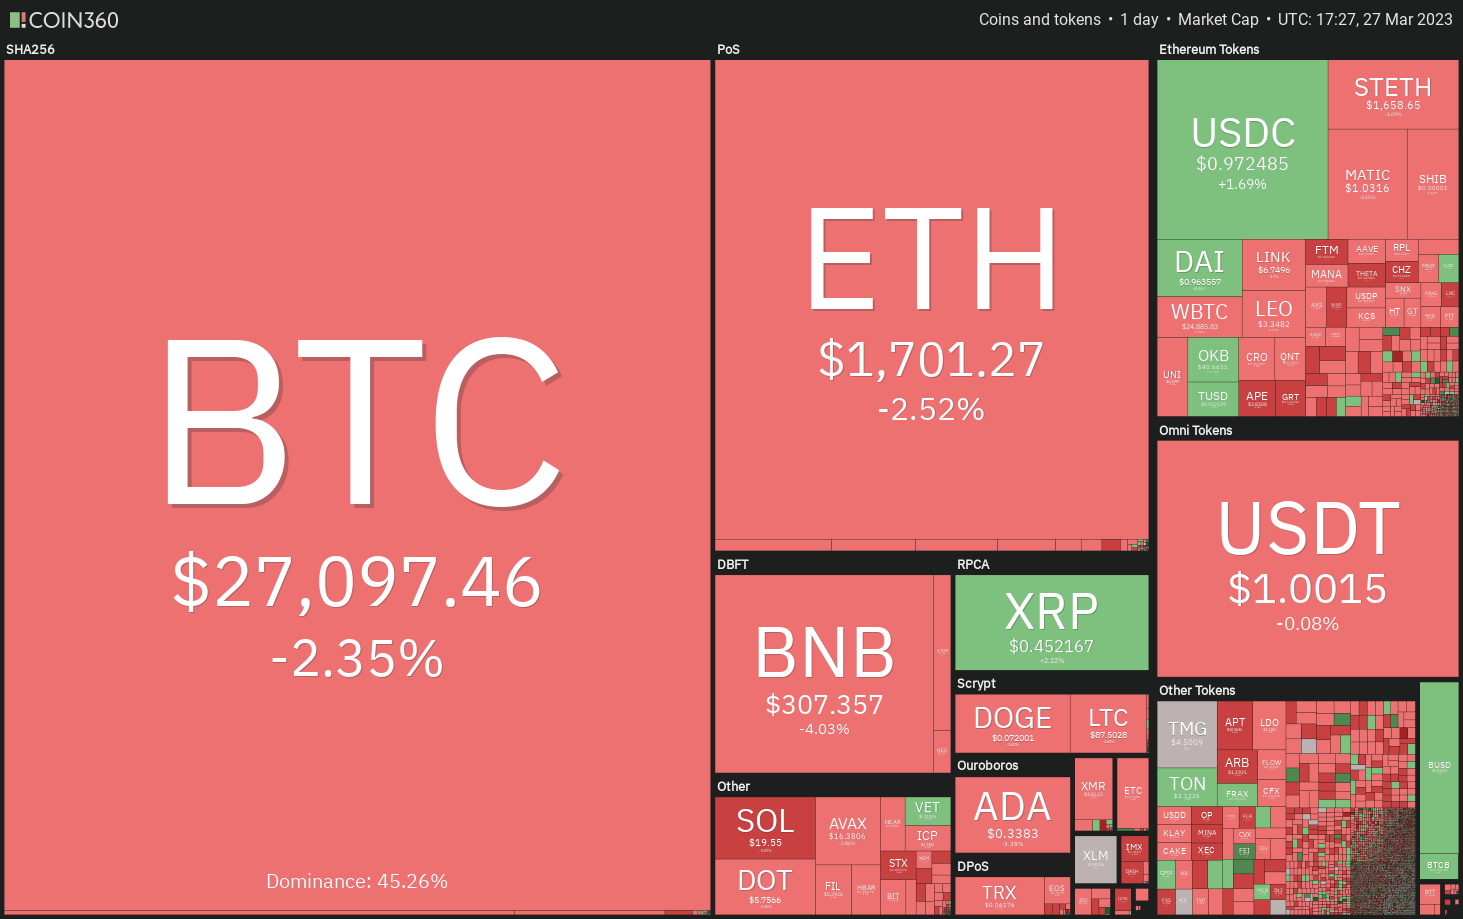
Nếu cuộc khủng hoảng ngân hàng được ngăn chặn, nó có thể dẫn đến một sự điều chỉnh ngắn hạn trong Bitcoin và altcoins nhưng bất kỳ vấn đề nào khác trong hệ thống ngân hàng di sản có thể tiếp tục thu hút đầu tư vào Bitcoin. Hãy nghiên cứu các biểu đồ để tìm ra mức hỗ trợ và kháng cự quan trọng trong Bitcoin và altcoins.
Phân tích giá chỉ số S&P 500
Chỉ số S & P 500 (SPX) đang giao dịch trong mô hình nêm mở rộng giảm dần. Những con bò đã cố gắng đẩy giá lên trên nêm vào ngày 22 tháng Ba nhưng những người bán giữ vững vị trí của họ.
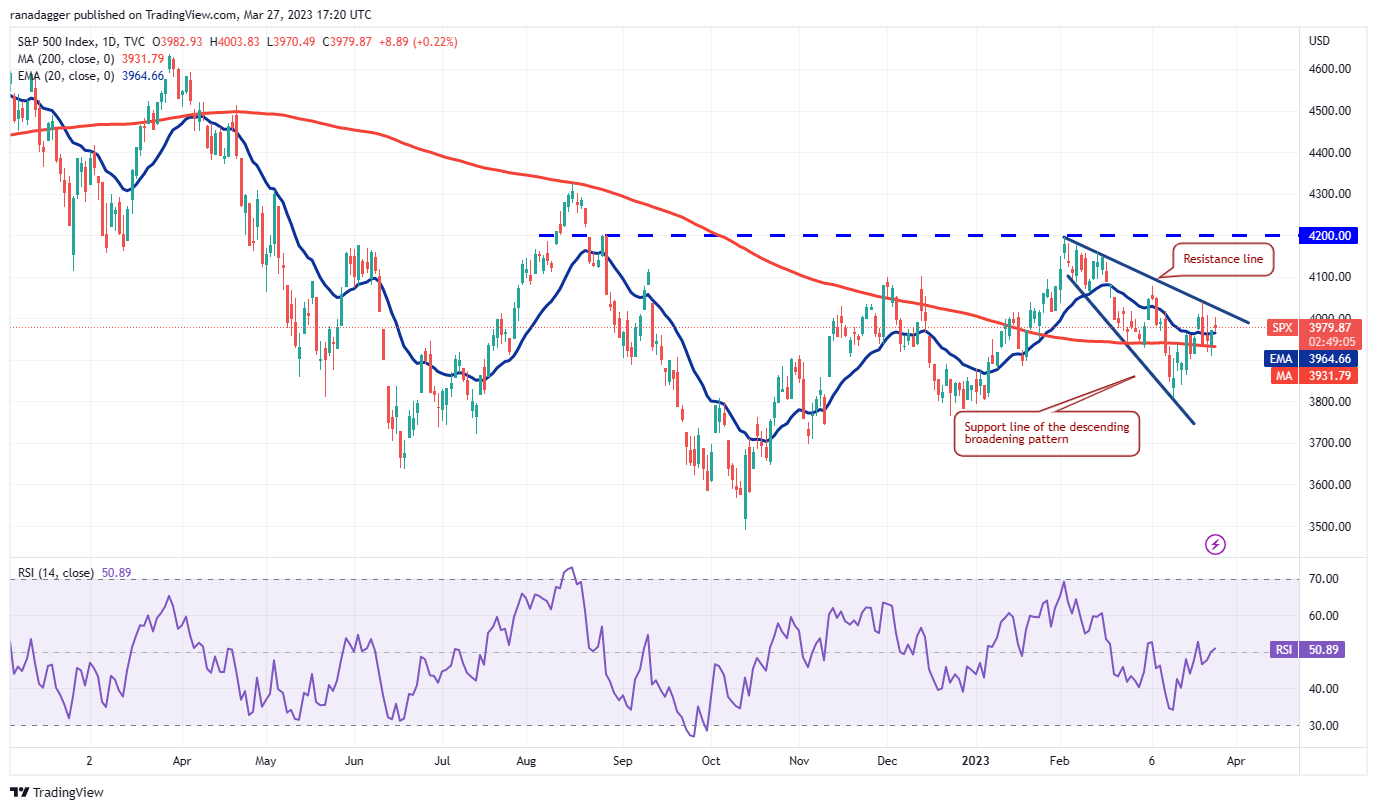
Người mua đẩy giá lên trên đường trung bình động cấp số mũ 20 ngày (3,964) vào ngày 27 tháng Ba nhưng mức bấc dài trên nến trong ngày cho thấy rằng những người mua không có tâm trạng nào để nản lòng. Người bán sẽ cố gắng giảm giá dưới mức trung bình động đơn giản 200 ngày (3,931). Nếu họ thành công, chỉ số có thể giảm xuống còn 3,800.
lại, nếu bulls bảo vệ đường trung bình động, nó sẽ gợi ý nhu cầu ở mức thấp hơn. Đà tăng có thể tăng lên sau khi người mua đẩy giá lên trên đường kháng cự của nêm. Chỉ số này sau đó có thể tăng vọt lên 4,200.
Phân tích giá chỉ số đô la Mỹ
Người mua đã đẩy chỉ số đô la Mỹ (DXY) lên trên đường trung bình động theo cấp số nhân 20 ngày (103) vào ngày 15 tháng Ba nhưng không thể xây dựng dựa trên sự phá vỡ. Điều này cho thấy gấu đang bán trên các cuộc biểu tình.
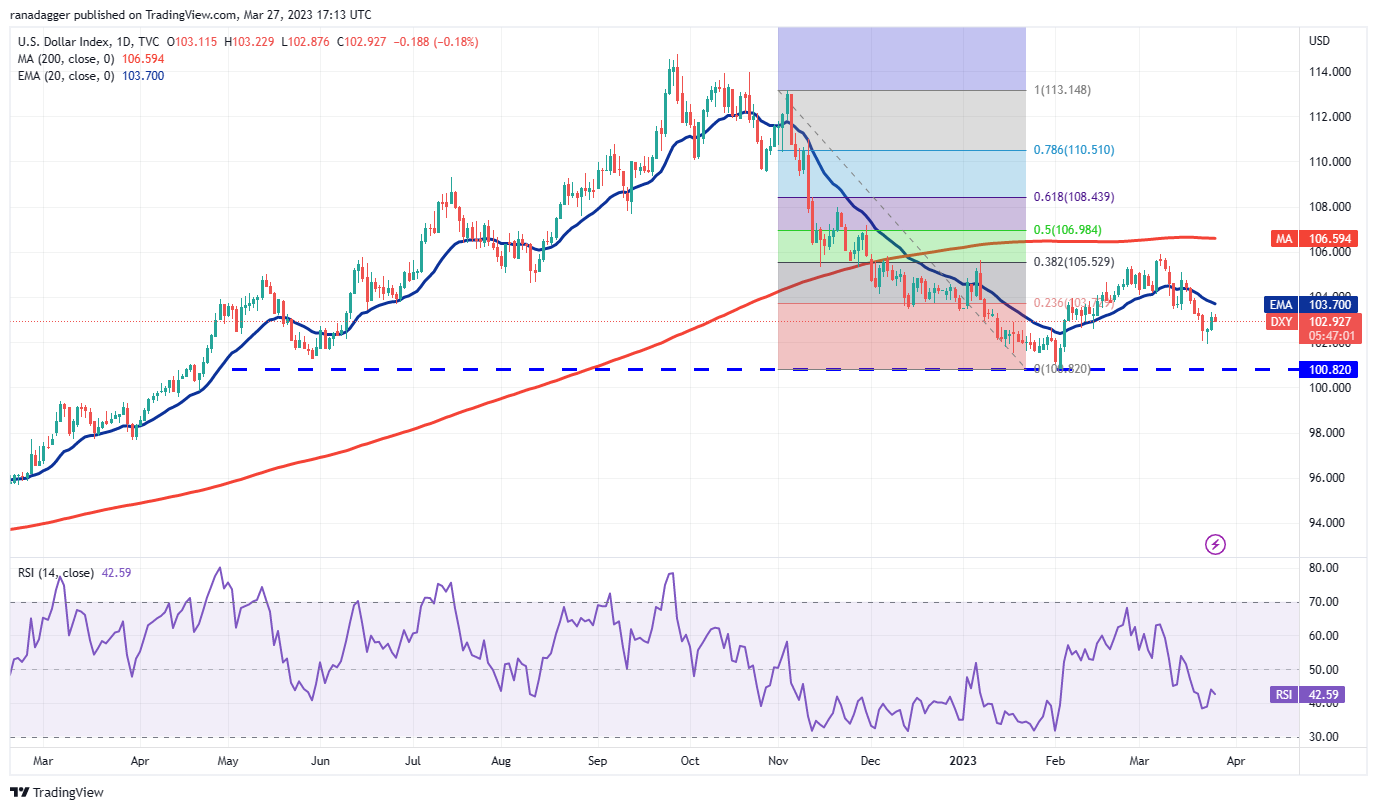
Chỉ số này có thể giảm xuống mức hỗ trợ mạnh tại 100.82, nơi mà những người mua sẽ cố gắng để bắt giữ sự suy giảm. Nếu giá bật lên khỏi mức này và tăng lên trên đường EMA 20 ngày, nó sẽ cho thấy chỉ số này có thể dao động giữa SMA 200 ngày (106) và 100.82 trong một thời gian nữa.
Một sự phá vỡ dưới mức 100.82 sẽ là một tiêu cực rất lớn vì điều đó sẽ hoàn thành mô hình đầu và vai (H&S) giảm. Chỉ số này sau đó có thể giảm xuống mức 95. Trên xu hướng tăng, một sự phá vỡ trên đường SMA 200 ngày có thể đẩy giá xuống mức Fibonacci hồi phục 61.8% là 108.43.
Phân tích giá Bitcoin
Bitcoin đã không thể vượt qua $29,000 trong vài ngày qua nhưng những con bò vẫn tiếp tục giữ vững. Họ đã không cho phép giá thậm chí giảm xuống mức phá vỡ $25,250.
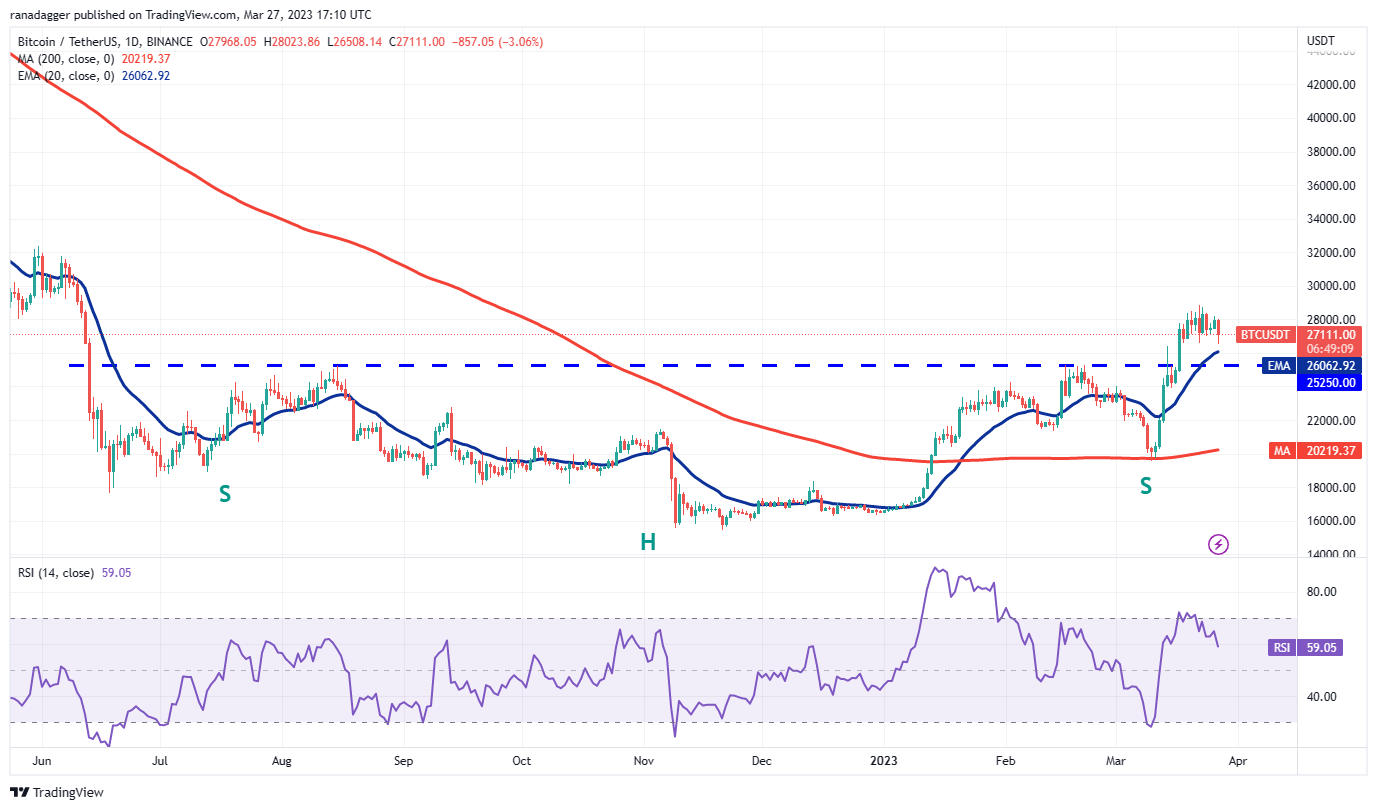
Đường EMA tăng 20 ngày ($26,062) và chỉ số sức mạnh tương đối (RSI) trong vùng tích cực cho thấy con đường kháng cự ít nhất là đi lên.
Nếu bulls đẩy giá lên trên $29,000, cặp BTC/USDT có thể nhanh chóng leo lên $32,500. Mức này có thể chứng kiến sự bán mạnh mẽ của những người giảm nhưng nếu người mua vượt qua rào cản này, cặp tiền có thể tăng lên $40,000.
điểm tích cực này có thể làm mất hiệu lực trong ngắn hạn nếu giá phá vỡ dưới $25,250. Sau đó, những con gấu tăng sẽ cố gắng đánh chìm cặp tiền xuống mức SMA 200 ngày (20,219 USD).
Ether price analysis
Ether (ETH) bounced off the 20-day EMA ($1,705) on March 25 but the bulls could not challenge the overhead resistance at $1,857. This shows that bears are selling on relief rallies.
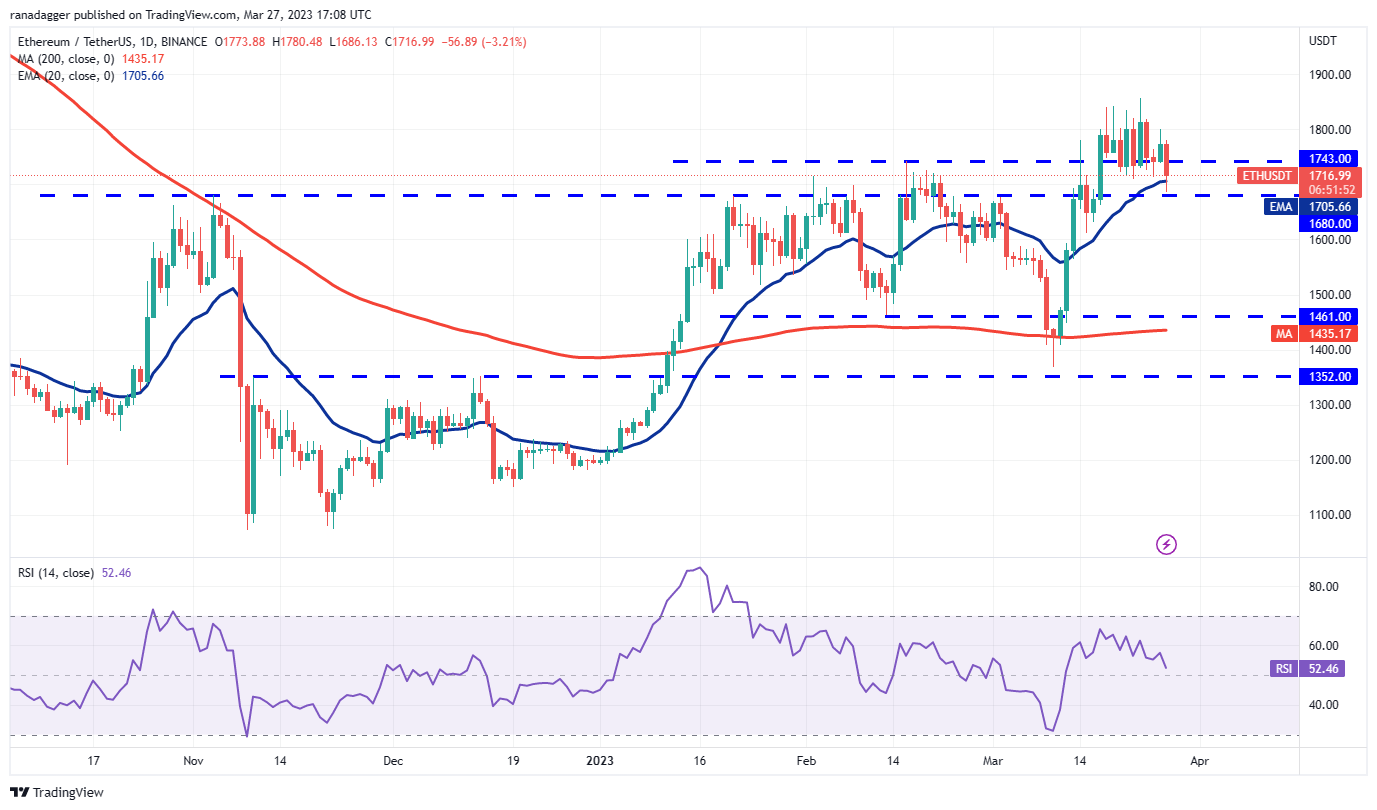
The bears will again try to sink the price below the 20-day EMA and the horizontal support at $1,680. If they can pull it off, the ETH/USDT pair may fall to $1,600. This is an important level for the bulls to defend because if this support cracks, the pair may tumble to the 200-day SMA ($1,435).
Alternatively, if the price rebounds off the 20-day EMA, it will suggest that the bulls continue to buy on minor dips. The pair could then rally to the stiff overhead resistance of $1,857. If this hurdle is crossed, the pair may jump to $2,000 and thereafter to $2,200.
BNB price analysis
BNB (BNB) bounced off the 20-day EMA ($317) on March 25 but the bulls could not clear the downtrend line, indicating that bears are selling on every minor rally.

The bears have pulled the price below the 20-day EMA. If they manage to sustain the lower levels, the BNB/USDT pair could plummet to the 200-day SMA ($290). This is an important level to watch out for because if it yields, the pair may nosedive to $265.
The first sign of strength will be a break and close above the downtrend line. That will indicate aggressive buying at lower levels. The pair may then attempt a rally to the $338 to $346 resistance zone.
XRP price analysis
The bulls flipped the moving averages into support and tried to resume the recovery in XRP (XRP). However, the higher levels are attracting aggressive selling as seen from the long wick on the March 27 candlestick.
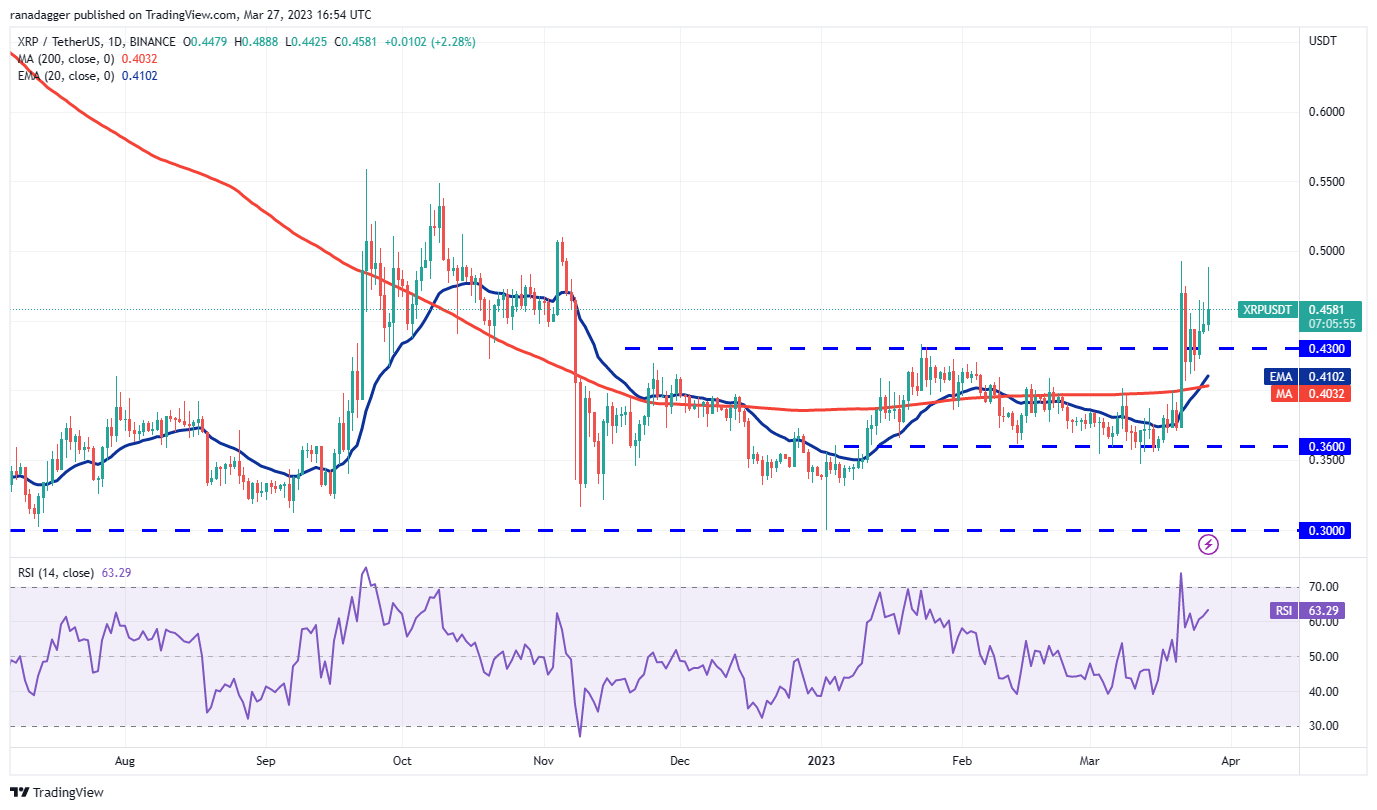
The bears will once again try to pull the XRP/USDT pair to the moving averages. If the price rebounds off the 20-day EMA ($0.41), it will suggest that buyers are accumulating at lower levels. The bulls may then make one more attempt to clear the overhead zone. If that happens, the pair may rally to $0.65 and eventually to $0.80.
On the other hand, if the price slips below the moving averages, it will suggest that the bears are back in control. The pair could then plunge to $0.36.
Cardano price analysis
Cardano (ADA) slipped below the 200-day SMA ($0.36) and reached the 20-day EMA ($0.35) on March 25. The bulls tried a recovery on March 26 but the bounce lacked strength.
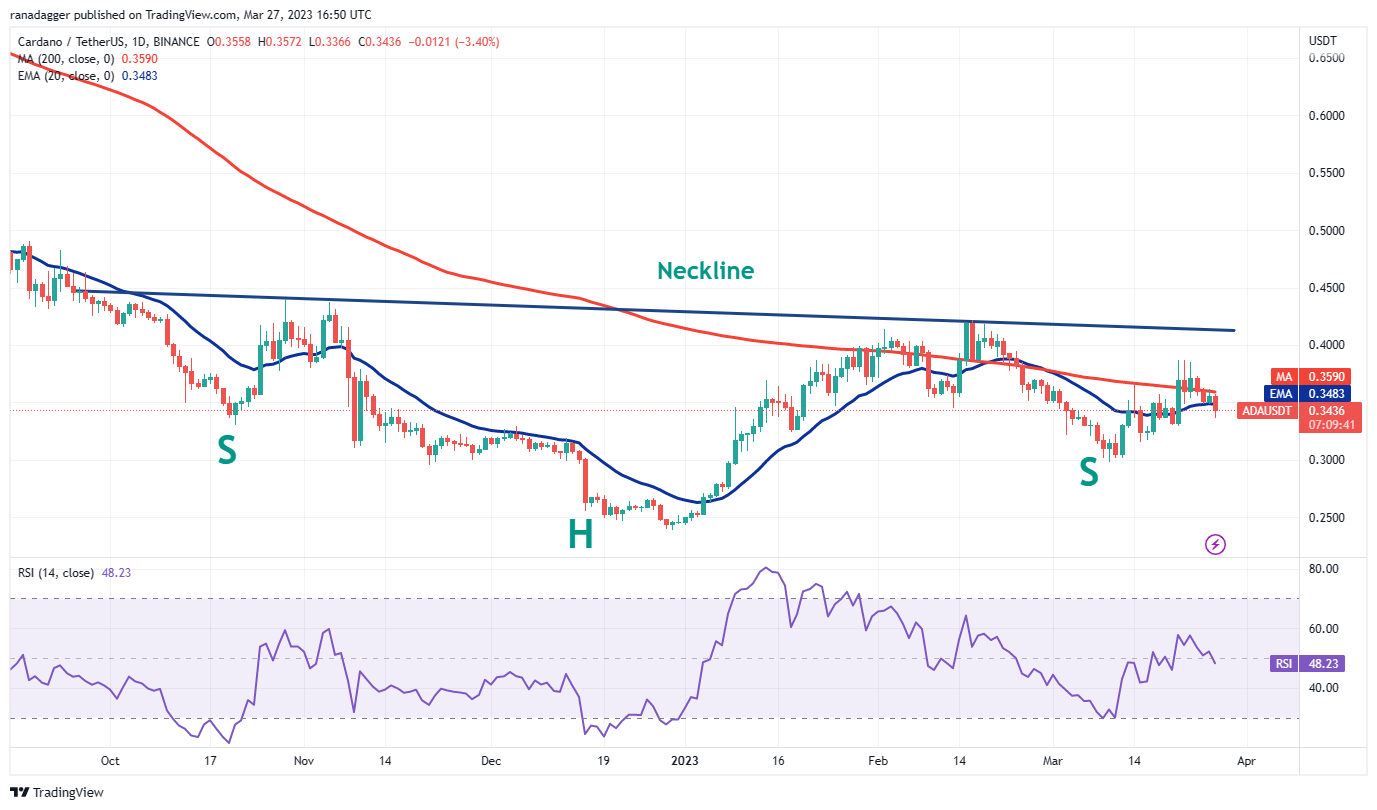
The bears will try to sustain the price below the 20-day EMA. If they manage to do that, it will indicate that the recent rally above the 200-day SMA may have been a bull trap. The ADA/USDT pair may first slide to $0.32 and then to $0.30.
Conversely, if the price turns up and breaks above the 200-day SMA, it will suggest demand at lower levels. The bulls will then make one more attempt to push the price to the neckline of the inverse H&S pattern.
Related: Why is Bitcoin price down today?
Polygon price analysis
Polygon’s (MATIC) shallow bounce off the strong support at $1.05 on March 25 suggests a lack of aggressive buying by the bulls. The bears are trying to strengthen their position by yanking the price below $1.05.

If bears sustain the breakdown, the MATIC/USDT pair may slump to the 200-day SMA ($0.97). This is an important level to keep an eye on because if it gives way, the sentiment will turn negative and the pair could tumble to $0.69.
If bulls want to prevent this decline, they will have to quickly push the price back above the 20-day EMA ($1.13). That will increase the likelihood of a rally to the strong overhead resistance zone between $1.25 and $1.30.
Dogecoin price analysis
Dogecoin (DOGE) has been swinging between the 200-day SMA ($0.08) and the horizontal support of $0.07 for the past few days.

The flattish 20-day EMA ($0.07) and the RSI just below the midpoint do not give a clear advantage either to the bulls or the bears. This suggests that the DOGE/USDT pair may spend some more time inside the range. The longer the time spent inside the range, the stronger will be the eventual breakout from it.
If the price collapses below $0.07, the pair could extend its decline to $0.06 and then to the vital support near $0.05. Instead, if the price breaks above the 200-day SMA, the pair may soar to the $0.10 to $0.11 resistance zone.
Solana price analysis
Solana (SOL) broke below the 20-day EMA ($20.93) on March 24. Buyers tried to push the price back above the 20-day EMA on March 25 and 26 but the bears held their ground. This suggests that the bears are trying to flip the 20-day EMA into resistance.
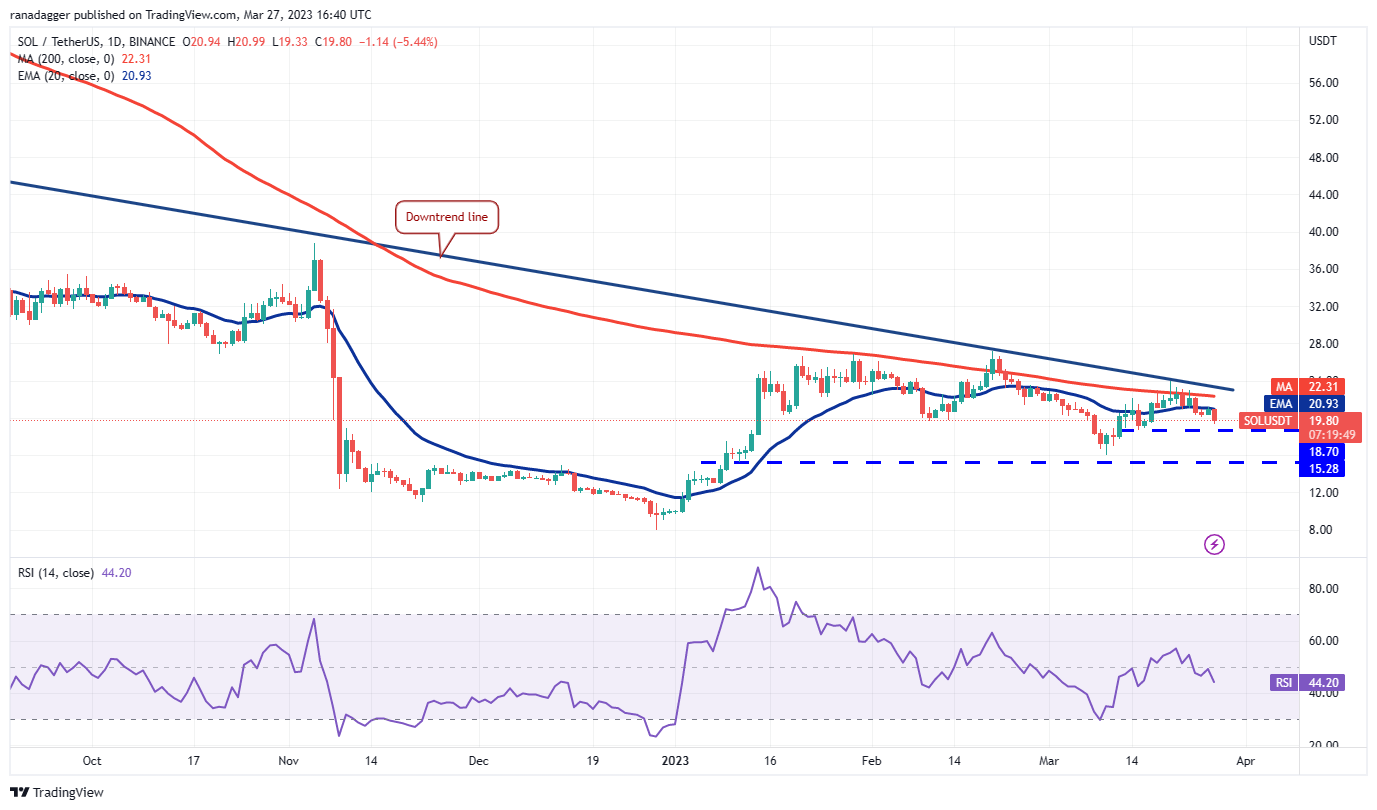
If the price sustains below $20, the SOL/USDT pair could retest the immediate support at $18.70. This level may attract buying but if bulls fail to propel the price above the 20-day EMA, the prospects of a fall to $15.28 increase.
Contrary to this assumption, if the price turns up from the current level and rises above the downtrend line, it will indicate that the downtrend may have ended. The pair could first rise to $27 and later attempt a rally to $39.
The views, thoughts and opinions expressed here are the authors’ alone and do not necessarily reflect or represent the views and opinions of Cointelegraph.
This article does not contain investment advice or recommendations. Every investment and trading move involves risk, and readers should conduct their own research when making a decision.


