Các nhà đầu tư dường như đã định giá trong một 25 điểm cơ bản tăng lãi suất của Cục Dự trữ Liên bang Hoa Kỳ vào ngày 3 tháng 5. Tiếp theo, họ sẽ tìm kiếm manh mối về hành động của Fed trong phần còn lại của năm
Liệu Fed sẽ duy trì lập trường diều hâu của mình khi lạm phát vẫn còn cao hơn phạm vi mục tiêu của nó hay liệu các rắc rối của ngân hàng và suy thoái sắp xảy ra làm cho ngân hàng trung ương tín hiệu tạm dừng việc tăng lãi suất?
Báo cáo Triển vọng các nhà kinh tế trưởng Diễn đàn Kinh tế Thế giới được công bố vào ngày 1 tháng 5 cho thấy 80% các nhà kinh tế trưởng tin rằng các ngân hàng trung ương phải duy trì một sự cân bằng tinh tế giữa “quản lý lạm phát và duy trì sự ổn định của ngành tài chính.” Các nhà kinh tế dự đoán rằng các ngân hàng trung ương sẽ thấy khó khăn trong việc hạ lạm phát xuống mức mục tiêu của họ
Arthur Hayes, đồng sáng lập và cựu giám đốc điều hành của các phái sinh crypto trao đổi BitMEX, trong một cuộc phỏng vấn độc quyền với Cointelegraph, cảnh báo các nhà đầu tư rằng đầu tư vào tài sản “bên ngoài hệ thống tài chính truyền thống” là cách duy nhất nếu họ muốn bảo toàn vốn của họ.
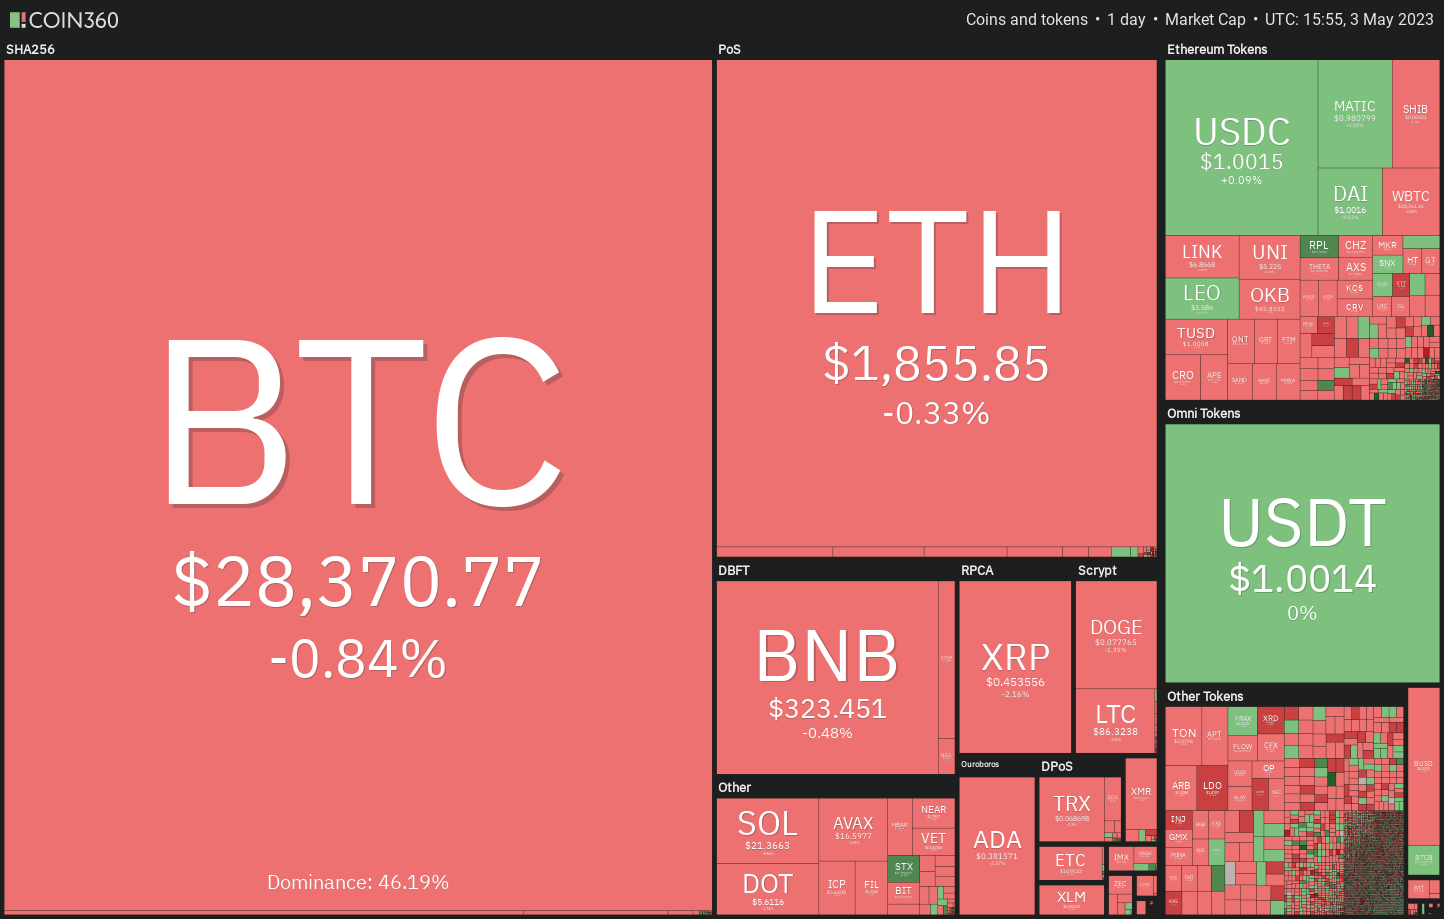
Liệu Bitcoin (BTC) và altcoins có thể bắt đầu tăng sau khi bật ra khỏi mức hỗ trợ chính? Hãy nghiên cứu các biểu đồ của 10 loại tiền điện tử hàng đầu để tìm hiểu
Phân tích giá Bitcoin
Hành động giá trong vài ngày qua đã hình thành một mô hình tam giác đối xứng trong Bitcoin. Nói chung, tam giác đối xứng hoạt động như một mô hình tiếp tục và giá vỡ ra theo hướng phổ biến trước khi hình thành phát triển
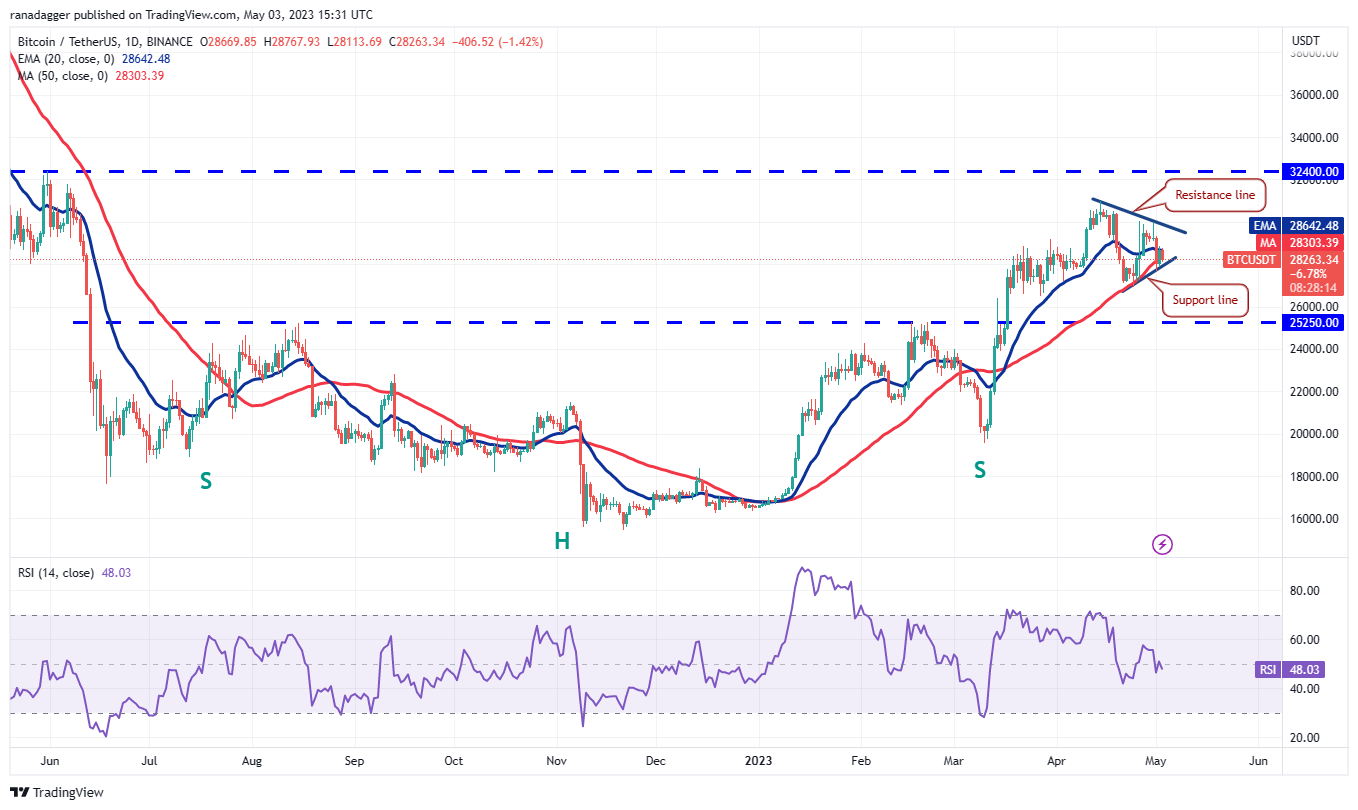
Tuy nhiên, tốt hơn là chờ đợi cho giá để hoàn thành đột phá trước khi thực hiện bất kỳ cược mới bởi vì đôi khi, thiết lập hoạt động như một mô hình đảo chiều.
Đường trung bình động cấp số nhân 20 ngày ($28,642) và chỉ số sức mạnh tương đối (RSI) gần trung điểm không mang lại lợi thế rõ ràng cho những người mua hoặc gấu.
Nếu giá tiếp tục thấp hơn và phá vỡ dưới tam giác, nó sẽ gợi ý sự bắt đầu của một giai đoạn điều chỉnh ngắn hạn. Cặp BTC/USDT có thể giảm xuống $25,250. Mức này có thể chứng kiến sự mua mạnh mẽ của những con bò đực
ược lại, nếu giá bật ra khỏi ngưỡng hỗ trợ và phá vỡ trên đường EMA 20 ngày, cặp tiền có thể tăng lên đường kháng cự. Một sự phá vỡ và đóng cửa trên tam giác sẽ mở ra cánh cửa cho một cuộc tăng tiềm năng đến $32,
400.
Phân tích giá Ether
Ether (ETH) đã nhảy ra khỏi đường hỗ trợ của mô hình tam giác đối xứng vào ngày 1 tháng Năm, cho thấy mức thấp hơn đang thu hút người mua.
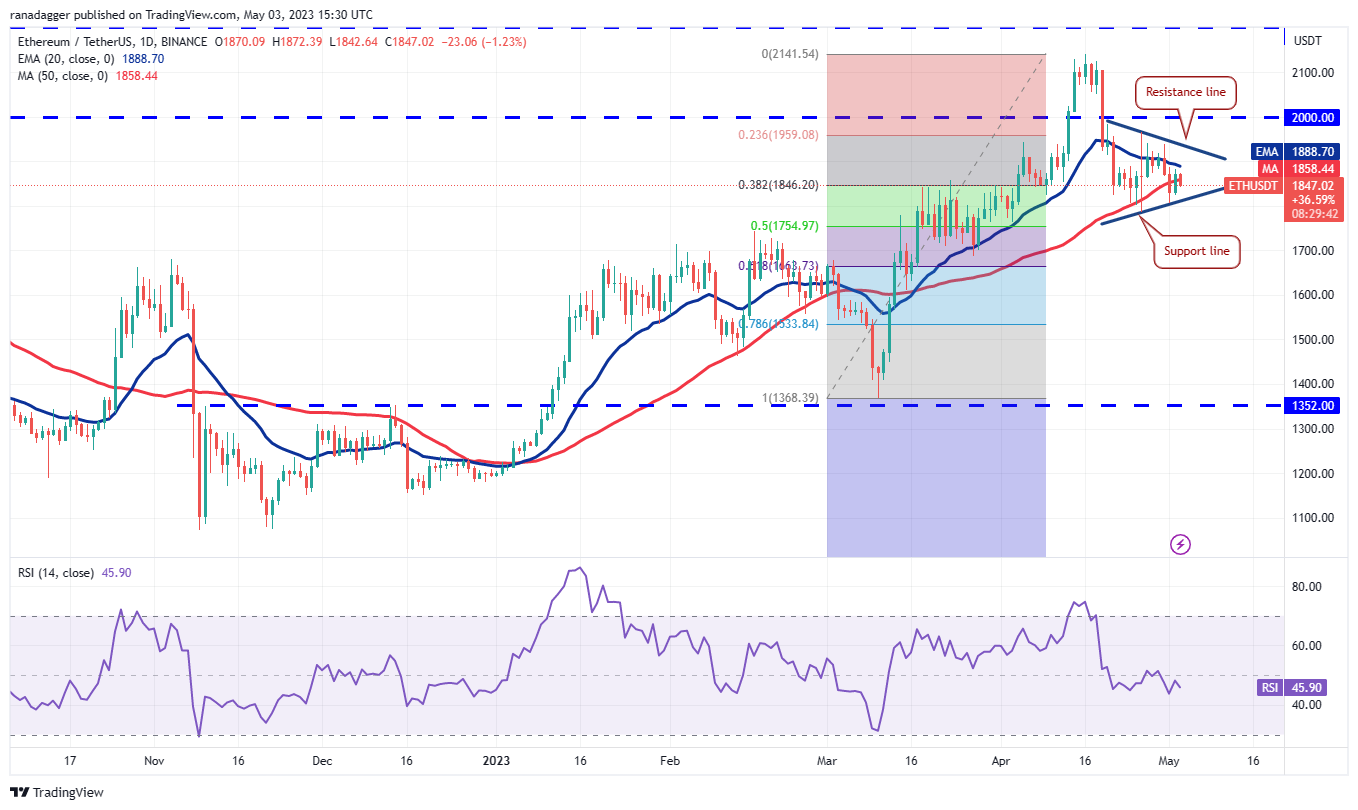
Những con bò đực sẽ cố gắng đẩy giá lên trên đường trung bình và thách thức đường kháng cự. Nếu người mua đẩy giá lên trên tam giác, cặp ETH/USDT có thể tăng lên $2,131. Có một kháng cự nhỏ ở mức $2,000 nhưng nó có khả năng sẽ bị vượt qua
ược lại, nếu giá quay xuống từ mức hiện tại, những người bán sẽ thực hiện một nỗ lực khác để chìm cặp tiền dưới tam giác. Nếu họ thành công trong nỗ lực của họ, cặp tiền có thể lao xuống mục tiêu mô hình $1,
619.
Phân tích giá BNB
BNB (BNB) vẫn bị kẹt bên trong mô hình tam giác đối xứng, cho thấy sự thiếu quyết định giữa những con bò đực và gấu
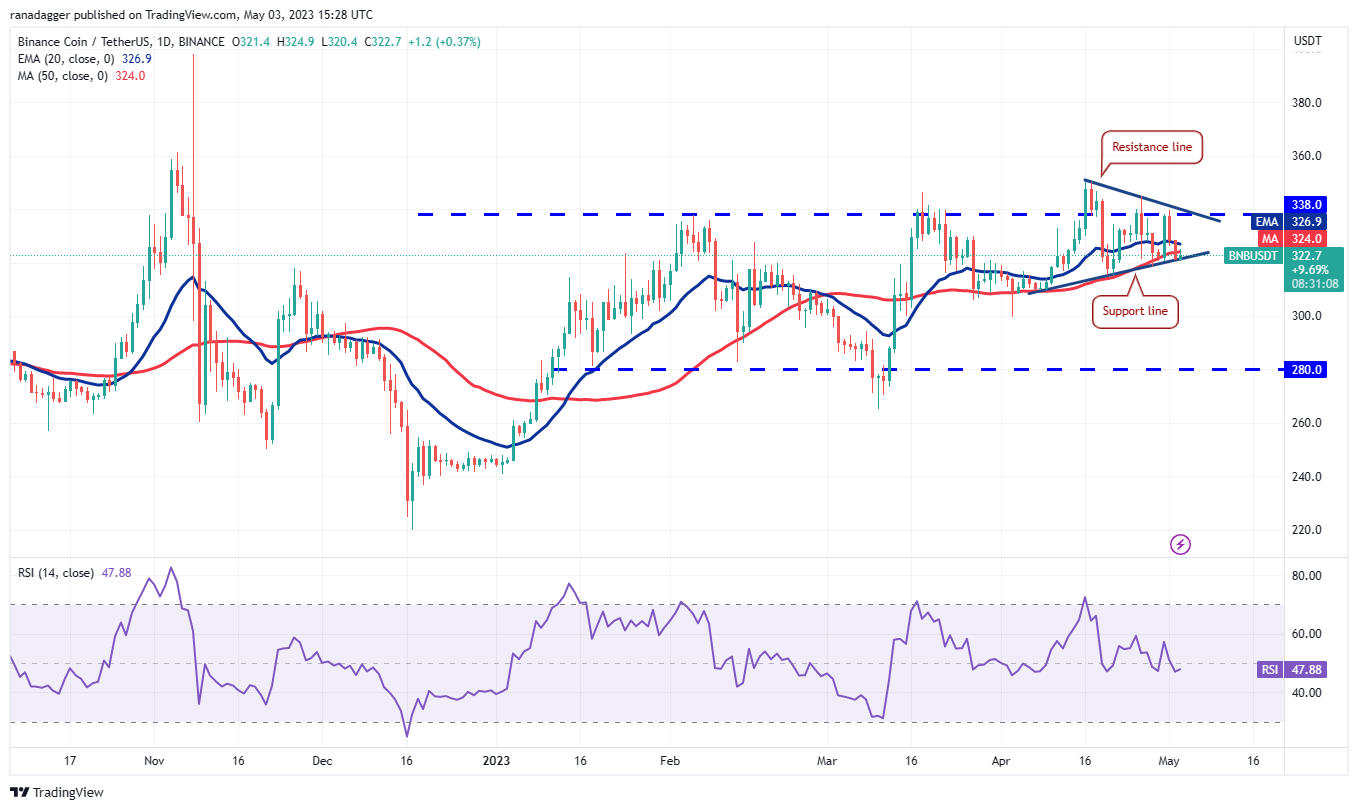
Người mua đang cố gắng bảo vệ đường hỗ trợ của tam giác. Nếu họ đẩy giá lên trên đường EMA 20 ngày ($326), cặp BNB/USDT có thể tăng lên đường kháng cự. Các nhà giao dịch sẽ phải vượt qua trở ngại này để báo hiệu sự bắt đầu của một xu hướng tăng mới
Alternatively, if the price collapses below the triangle, it will suggest that the uncertainty has resolved in favor of the bears. The pair may then slide to $300 and thereafter extend the fall to the pattern target of $280.
XRP price analysis
The long tail on the May 1 and 2 candlesticks shows that the bulls tried to start a recovery in XRP (XRP). However, they could not sustain the buying pressure and the price turned lower on May 3.
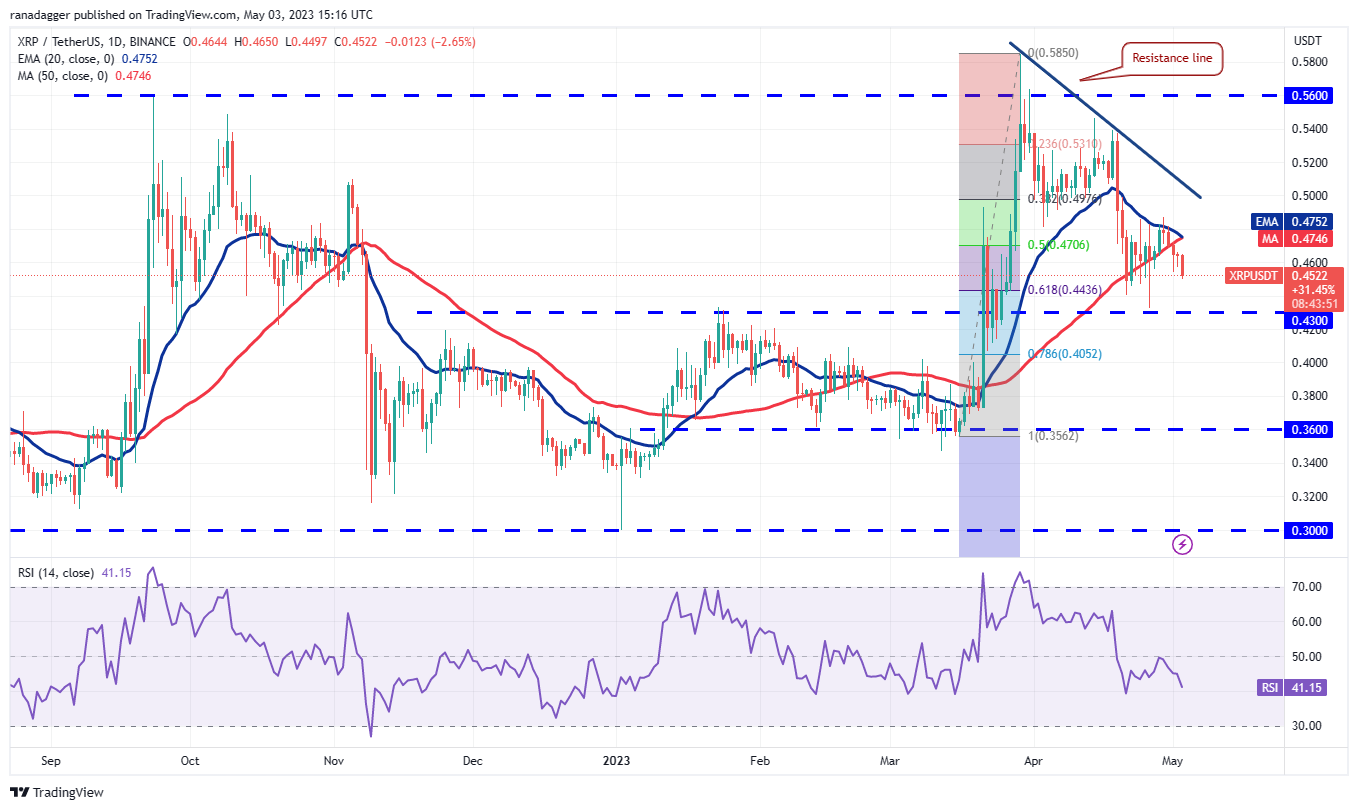
The bears will try to extend the decline to the strong support at $0.43. This remains the key level to watch for in the near term. If this support crumbles, the XRP/USDT pair may drop to $0.36. This level is likely to attract aggressive buying by the bulls.
Instead, if the price turns up from $0.43 and breaks above the 20-day EMA ($0.47), it will signal that bulls are on a comeback. The pair could then rally to the resistance line. If buyers surmount this hurdle, the pair may surge to $0.54.
Cardano price analysis
The bulls held Cardano (ADA) above the 50-day simple moving average ($0.38) on May 2 but they failed to overcome the obstacle at the 20-day EMA ($0.39).
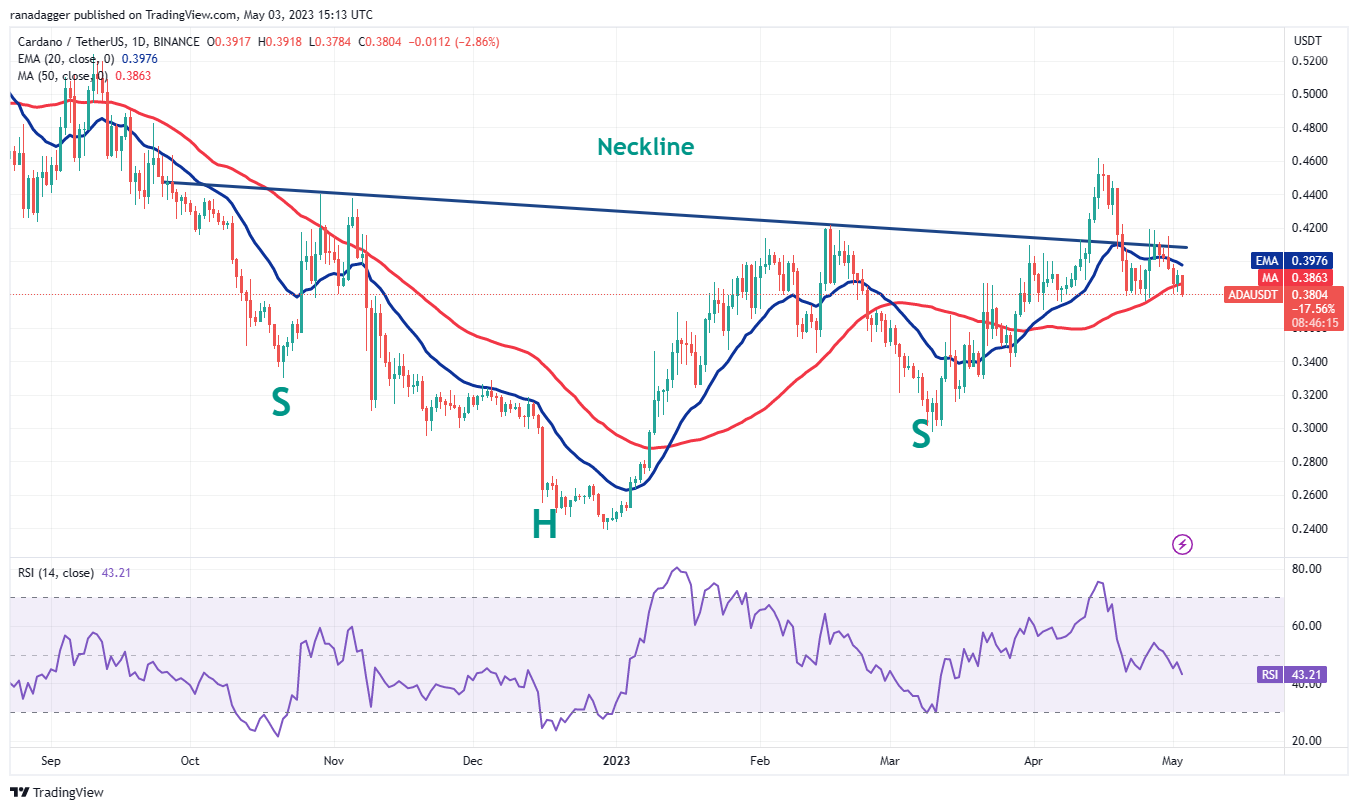
The bears are trying to pounce on this opportunity and close the ADA/USDT pair below the 50-day SMA. There is a minor support at $0.37 but if that cracks, the selling could pick up momentum and the pair may slump to $0.33 and later to $0.30.
The important resistance on the upside is the neckline of the inverse head and shoulders pattern. Buyers will have to drive the price above this level to signal a potential trend change in the near term. The pair can then surge to $0.46.
Dogecoin price analysis
Dogecoin (DOGE) is struggling to bounce off the strong support near $0.08, which suggests a lack of demand from the bulls.
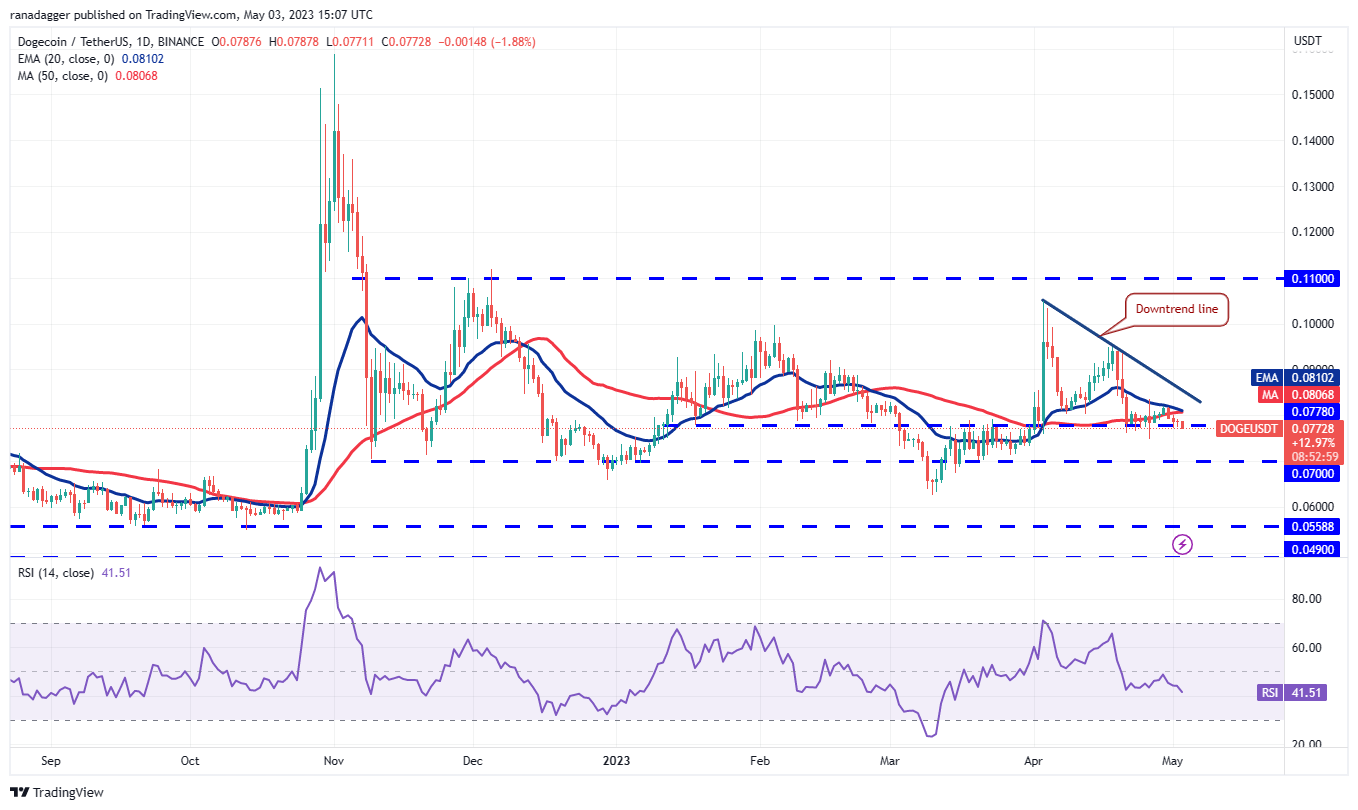
The 20-day EMA ($0.08) is sloping down and the RSI is below 42, indicating that the path of least resistance is to the downside. If the support near $0.08 is breached, the DOGE/USDT pair could plummet to the next major support at $0.07.
If bulls want to prevent this decline, they will have to quickly push the price above the downtrend line. The pair may then rally to $0.09 and thereafter dash toward the stiff overhead resistance at $0.11.
Polygon price analysis
Polygon (MATIC) bật lên khỏi ngưỡng hỗ trợ $0.94 vào ngày 2 tháng 5, cho thấy những con bò đang cố gắng bảo vệ mức này một cách mạnh mẽ.
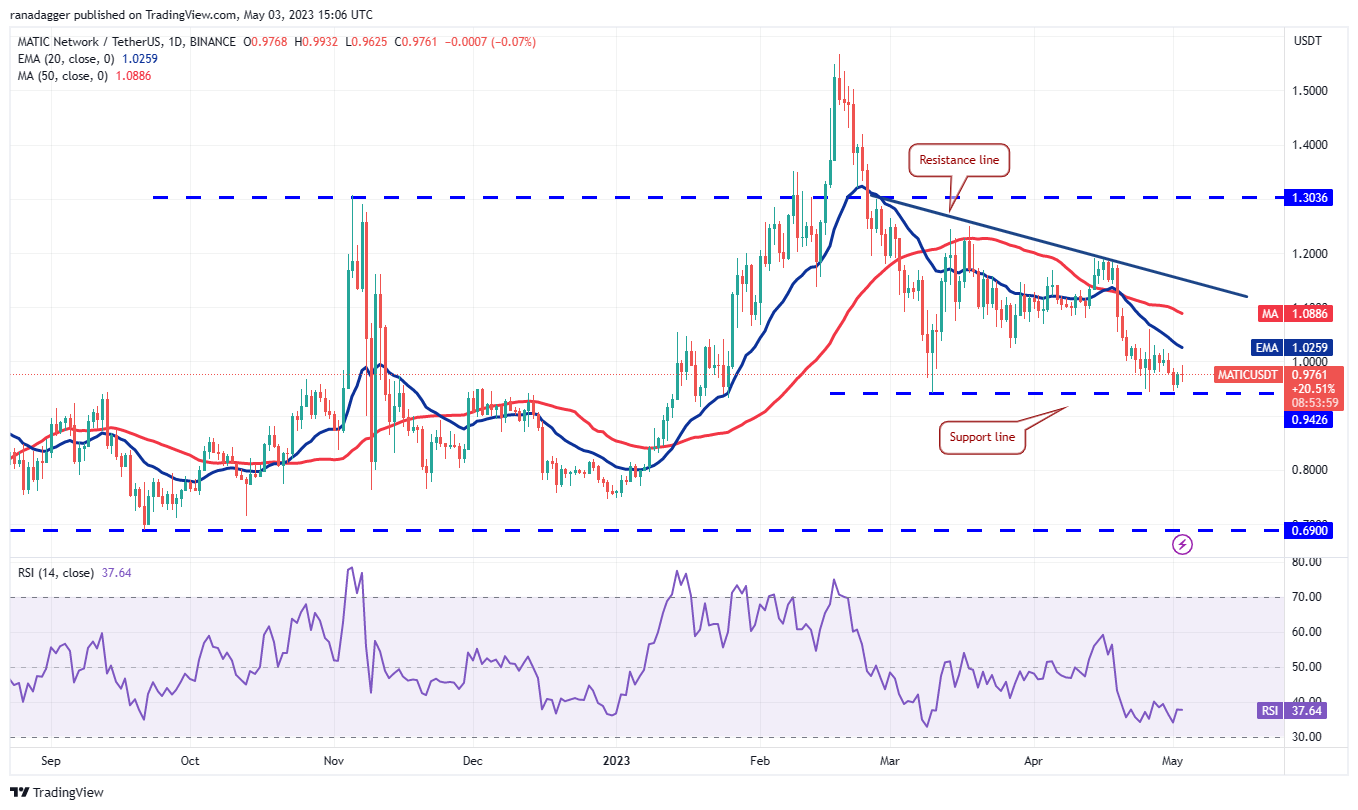
The 20-day EMA ($1.02) is sloping down and the RSI is in the negative zone, indicating that the sentiment remains negative. Sellers will try to stall the recovery at the 20-day EMA. If they succeed, the MATIC/USDT pair may turn down and fall to $0.94.
The repeated retest of a support level within a short interval tends to weaken it. If this support gives way, the selling could intensify and the pair may nosedive to $0.69. Buyers will have to kick the price above the resistance line to invalidate the bearish view.
Related: Litecoin price poised for 700% gains vs. Bitcoin, says Charlie Lee
Solana price analysis
Buyers defended the 50-day SMA ($21.78) on May 2 but they could not propel Solana (SOL) above the 20-day EMA ($22.26). This shows that the bears are selling on every minor rally.
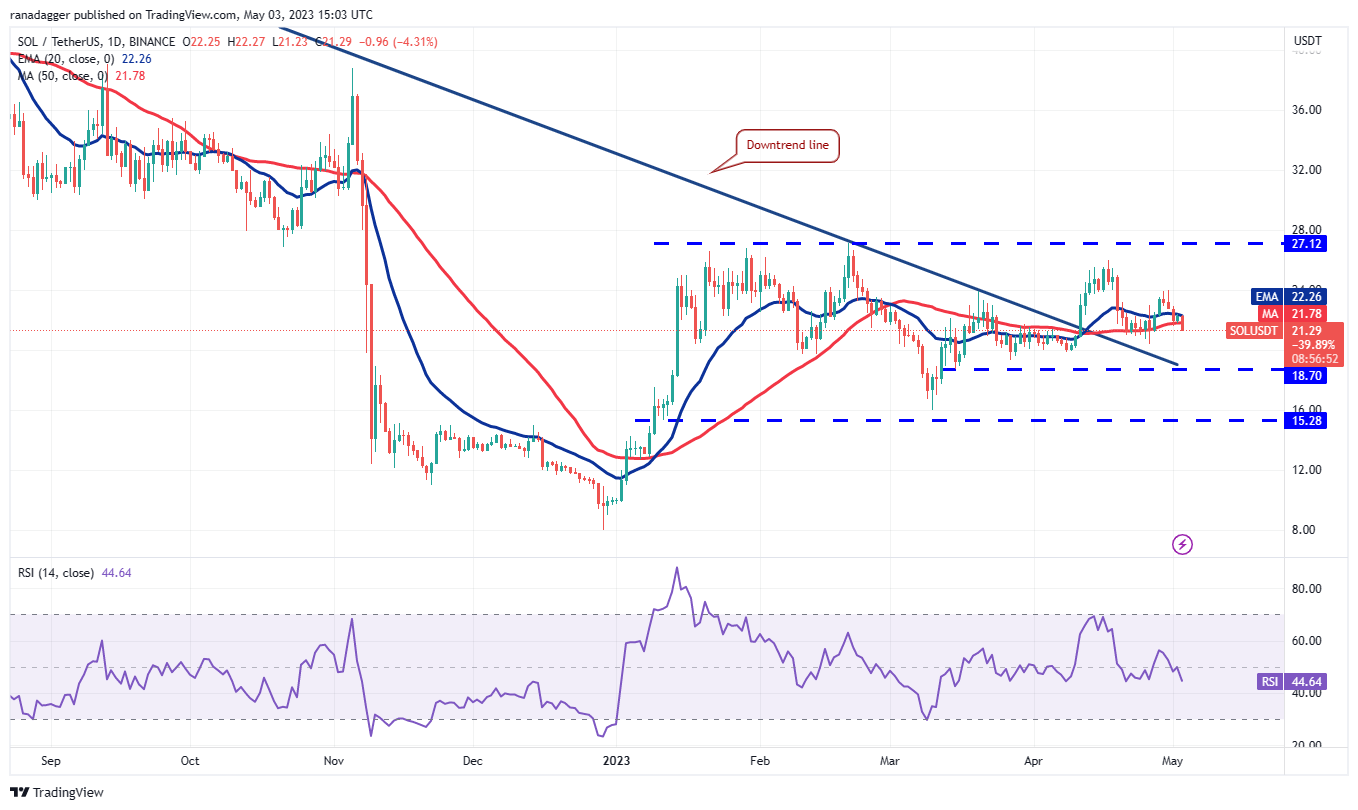
The bears have pulled the price below the 50-day SMA. If they sustain the breakdown, the SOL/USDT pair could reach the next strong support at $18.70. The possibility of a bounce off this level remains high. If that happens, the pair may stay range-bound between $18.70 and $27.12 for some more time.
Contrarily, if the price turns up and breaks above the 20-day EMA, it will suggest that the bulls are attempting a comeback. The pair could then rally to $24 and later dash to the overhead resistance at $27.12.
Polkadot price analysis
Polkadot (DOT) slipped below the $5.70 support on May 1 and the bears are trying to build upon this advantage on May 3.
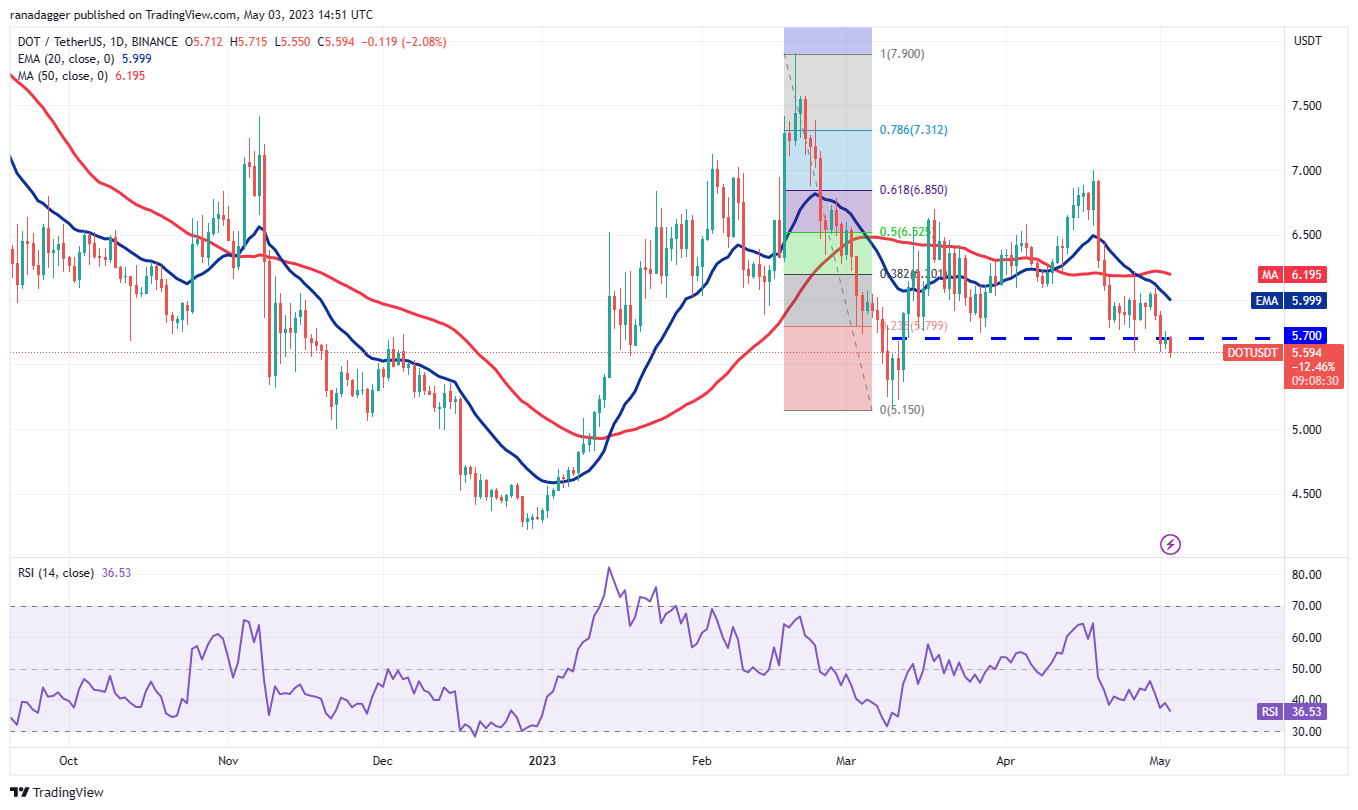
The bulls attempted a recovery on May 2 but the shallow bounce showed a lack of aggressive buying near $5.70. This suggests that the DOT/USDT pair may continue lower and reach the crucial support at $5.15.
Time is running out for the bulls. If they want to start a sustained recovery, they will have to quickly push the price above the moving averages. If they manage to do that, the pair may pick up momentum and rally toward $7.
Litecoin price analysis
Litecoin (LTC) is getting squeezed between the 20-day EMA ($89) and the horizontal support at $85. The moving averages have completed a bearish crossover and the RSI is in the negative zone, indicating that bears hold the edge.
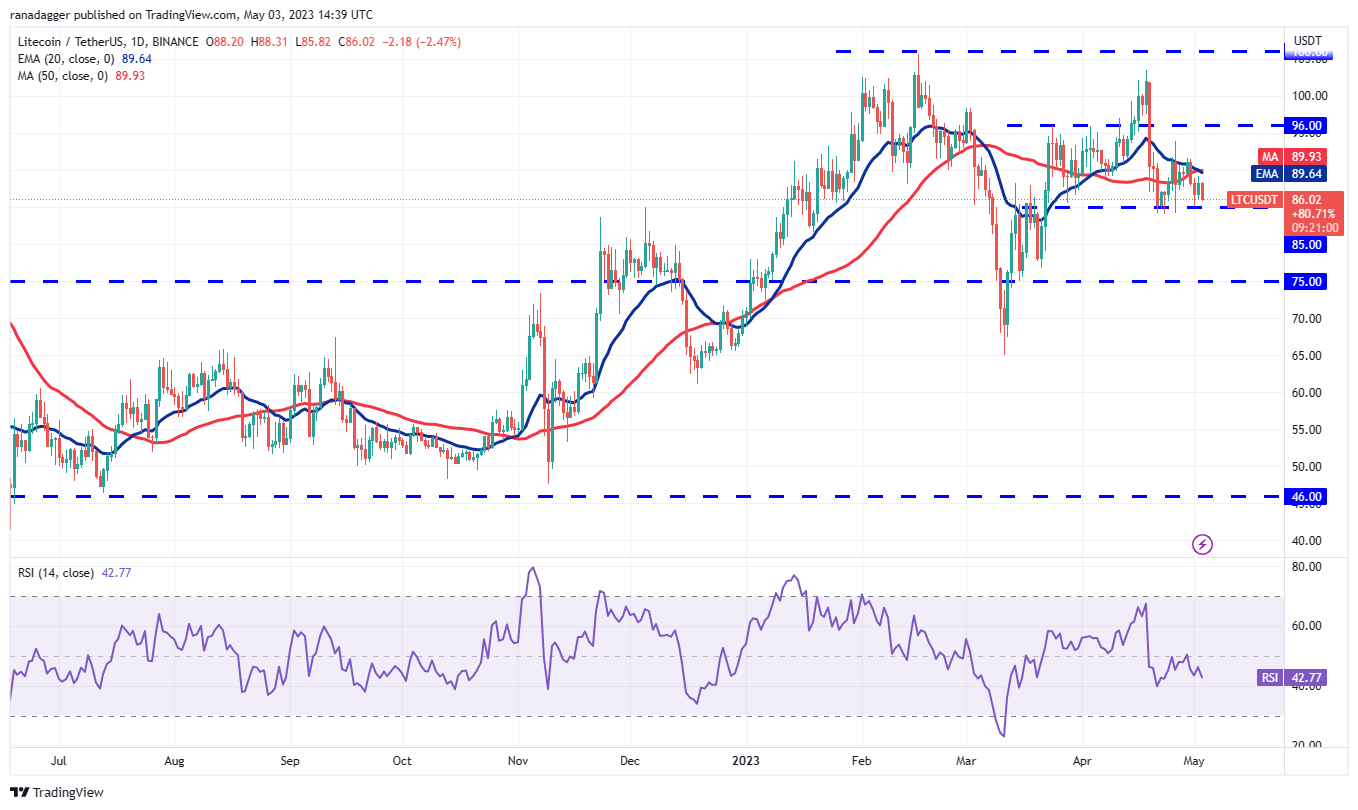
If bears tug the price below $85, the selling could intensify and the LTC/USDT pair may plunge to the strong support at $75. The bulls are expected to defend this level with all their might because a break below it will open the doors for a further drop to $65.
Another possibility is that the price rebounds off the current level and rises above the moving averages. Such a move will suggest accumulation at lower levels. The pair may then rise to $96 and above it to $106.
This article does not contain investment advice or recommendations. Every investment and trading move involves risk, and readers should conduct their own research when making a decision.


