Bitcoin continues to trade near $31,000, making it an important resistance level to watch out for in the short term. Some analysts believe the current consolidation could result in an upside breakout in Bitcoin.
Các nhà đầu tư tổ chức dường như cũng tích cực về triển vọng của một đợt tăng giá tiếp theo của Bitcoin (BTC). Giám đốc nghiên cứu của CoinShares James Butterfill cho biết trong một báo cáo gần đây rằng 98% của tất cả các dòng tài sản kỹ thuật số trị giá 334 triệu đô la đã đi vào các
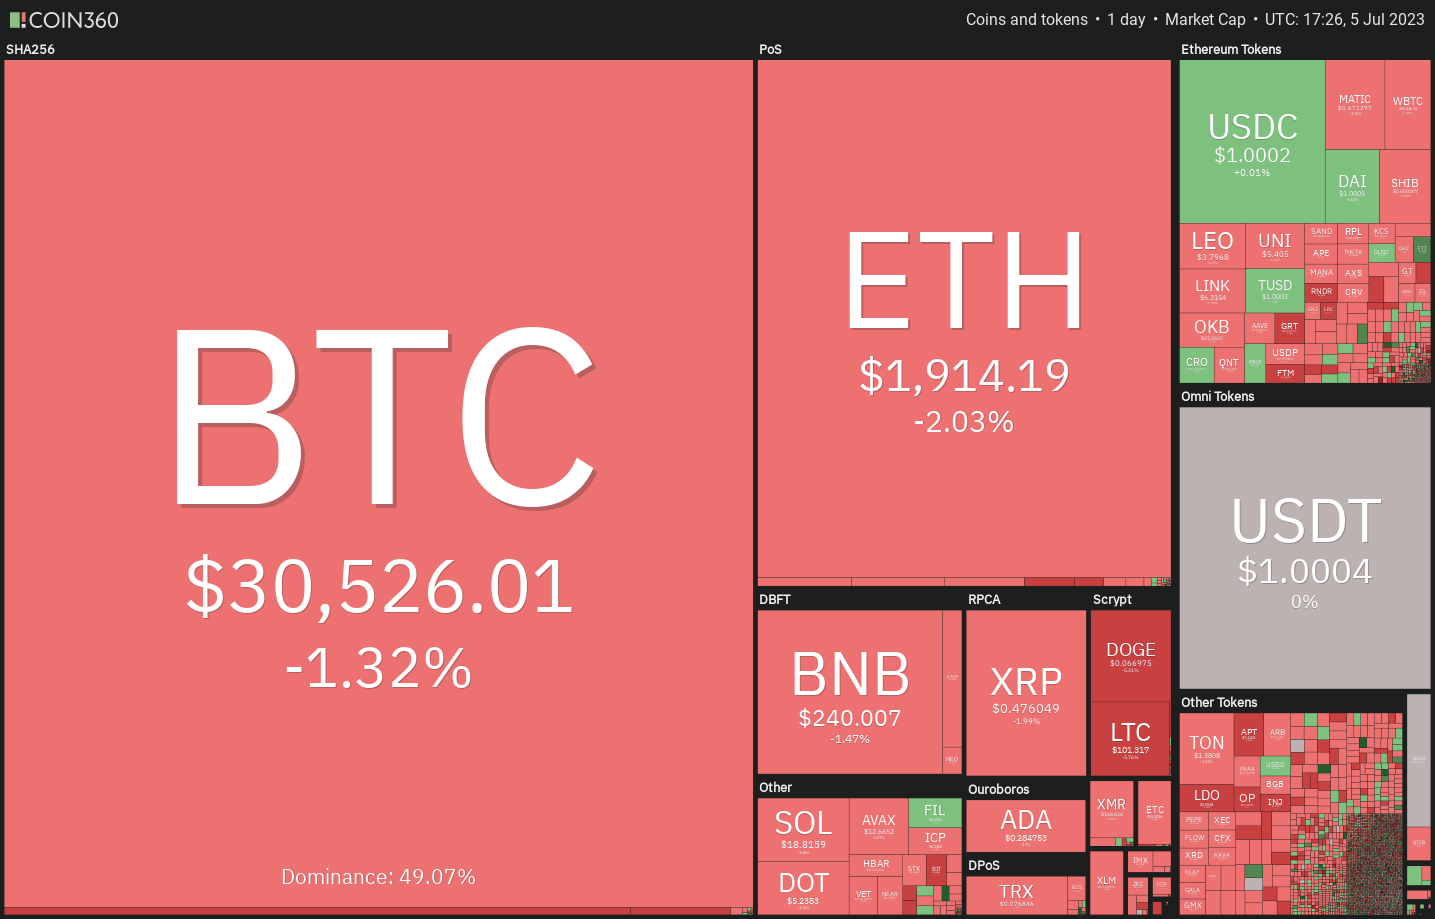
Mặc dù hành động giá ngắn hạn đối với Bitcoin và các altcoin được chọn có vẻ tích cực, những người tham gia thị trường nên thận trọng do sự không chắc chắn liên quan đến các vấn đề kinh tế vĩ mô. Thị trường tiền điện tử có khả năng bị ảnh hưởng bởi số liệu lạm phát của Hoa Kỳ và hành động tiền tệ của Cục Dự trữ Liên bang trong vài tuần tới.
Các mức hỗ trợ ngắn hạn quan trọng trên Bitcoin và altcoin cần giữ để tiếp tục phục hồi là gì? Hãy cùng nghiên cứu biểu đồ của 10 loại tiền điện tử hàng đầu để tìm hiểu.
Phân tích giá Bitcoin
Bitcoin đã phá vỡ và đóng cửa trên mức 31,000 đô la vào ngày 3 tháng 7, nhưng phe bò không thể xây dựng dựa trên sức mạnh này. Điều này cho thấy những con gấu vẫn chưa bỏ cuộc.
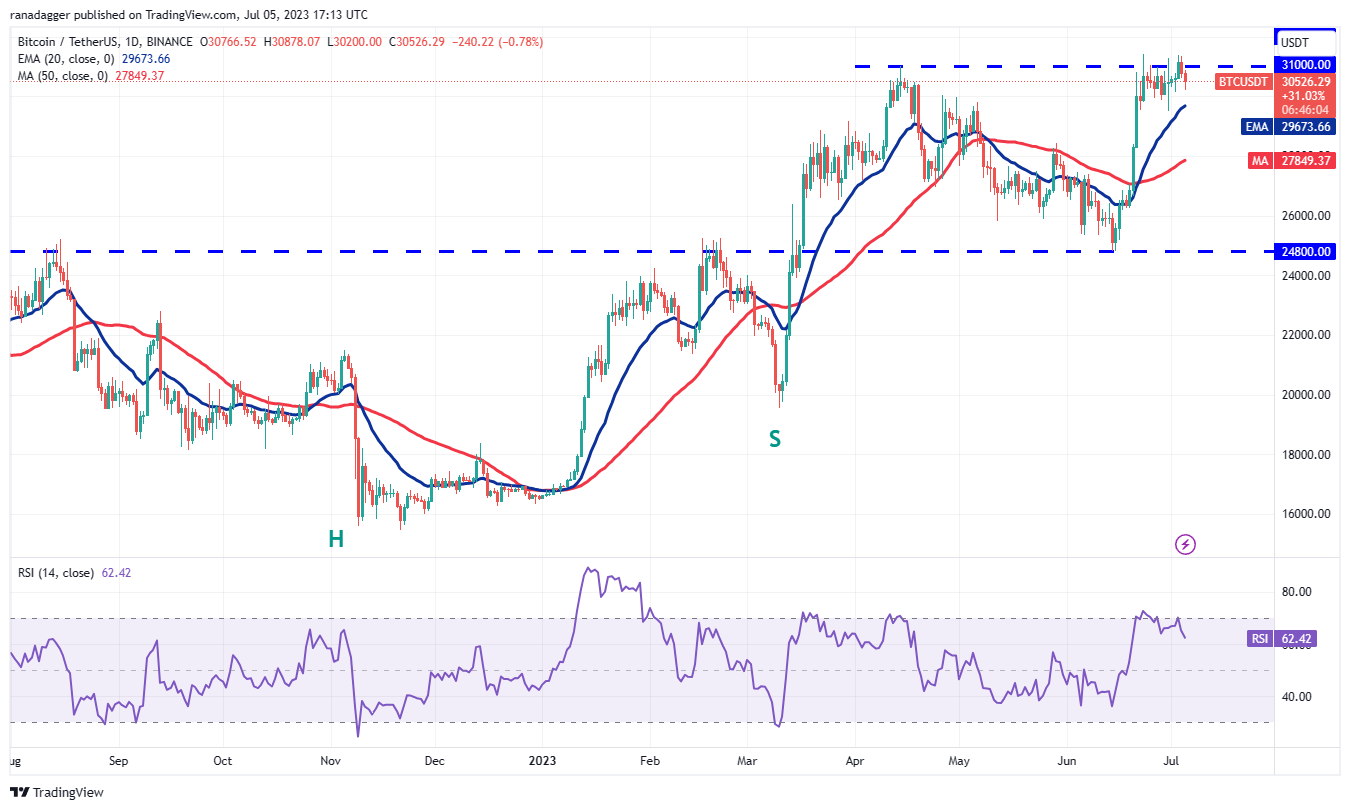
Đường trung bình động theo cấp số nhân (EMA) trong 20 ngày là 29,673 đô la là mức quan trọng cần chú ý về nhược điểm. Nếu giá tăng trở lại khỏi mức này, nó sẽ gợi ý rằng phe bò đang mua mức giảm.
Điều đó sẽ nâng cao triển vọng bứt phá trên vùng trên $31,000 đến 31.432 đô la. Cặp BTC/USDT sau đó có thể tăng lên 32.400 đô la, nơi phe gấu có thể một lần nữa đặt ra một thách thức
Quan điểm tích cực này sẽ bị phủ nhận trong thời gian tới nếu giá giảm và phá vỡ dưới đường EMA 20 ngày. Điều đó có thể đưa cặp tiền này xuống mức trung bình động đơn giản 50 ngày (SMA) là 27.849 đô la
Phân tích giá Ether
Ether (ETH) đã giảm từ ngưỡng kháng cự trên 2,000 đô la, cho thấy phe gấu đang tích cực bảo vệ mức này.
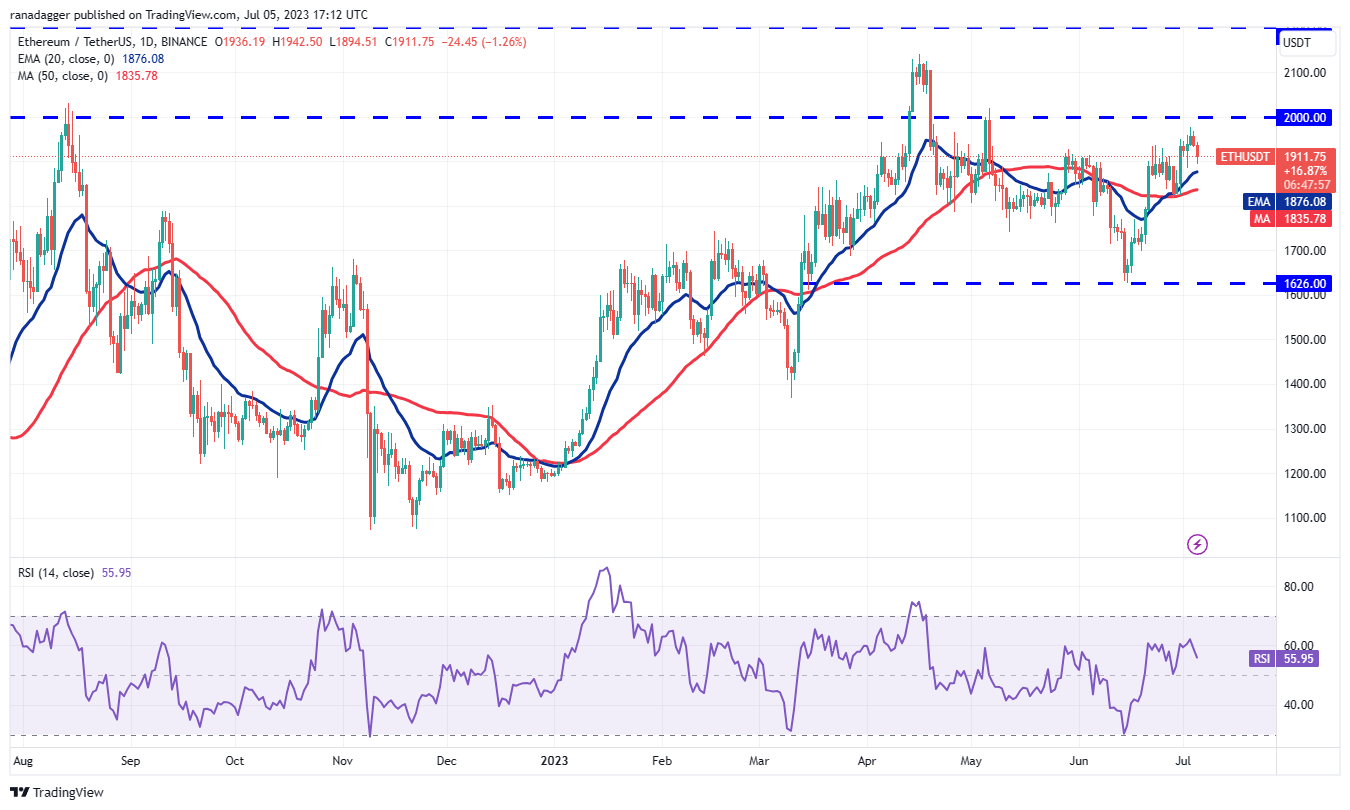
Phe gấu sẽ phải chìm và duy trì giá dưới mức trung bình động để chỉ ra rằng cặp ETH/USDT có thể tiếp tục hợp nhất trong khoảng từ 2,000 đô la đến 1,626 đô la trong một thời gian nữa.
Ngoài ra, nếu giá phục hồi khỏi đường EMA 20 ngày (1.876 đô la), điều đó sẽ cho thấy rằng tâm lý đã chuyển sang tích cực và các nhà giao dịch đang mua mức giảm. Điều đó sẽ nâng cao triển vọng phá vỡ trên 2.000 đô la. Cặp tiền này sau đó có thể tăng vọt lên vùng kháng cự $2,142 đến $
BNB price analysis
Buyers tried to stretch BNB’s (BNB) recovery above the 20-day EMA ($245) on July 3, but the bears aggressively sold near the 38.2% Fibonacci retracement level of $252.
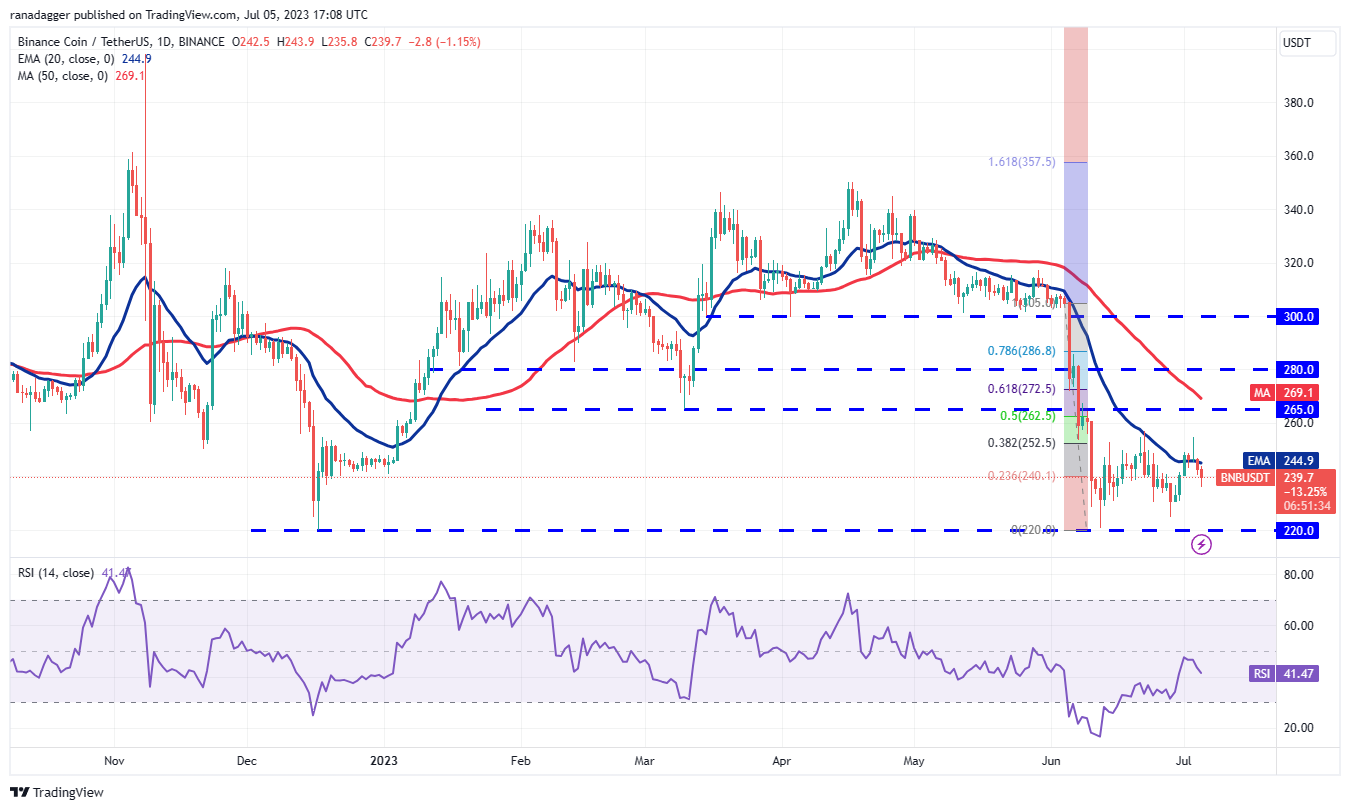
Giá đã trượt trở lại dưới đường EMA 20 ngày vào ngày 4 tháng 7, cho thấy phe gấu vẫn hoạt động ở mức cao hơn. Đường EMA 20 ngày phẳng và chỉ số sức mạnh tương đối (RSI) trong vùng âm cho thấy cặp BNB/USDT có thể tiếp tục dao động trong khoảng 257 đô la đến 220 đô la
Thay vào đó, nếu giá tăng từ mức hiện tại và phá vỡ trên $257, điều đó sẽ cho thấy tâm lý đang dần chuyển sang tích cực và phe bò đang mua mức giảm. Động lực tích cực có thể tăng lên sau khi người mua đẩy giá lên trên vùng kháng cự $257 đến $265
Phân tích giá XRP
The bears have held off the attempts by the bulls to drive and sustain XRP (XRP) above the moving averages, indicating that higher levels continue to attract sellers.
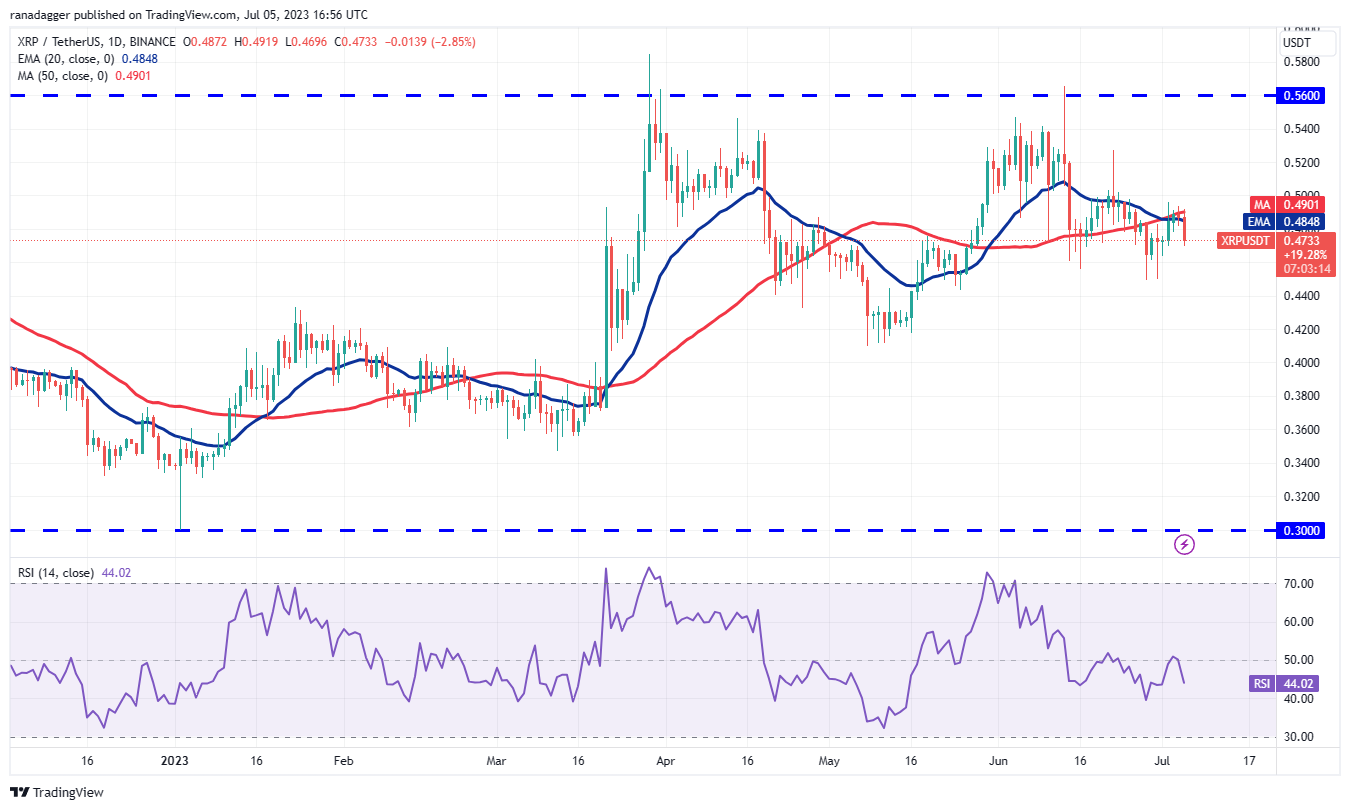
The bears will try to strengthen their position further by pulling the price below the immediate support at $0.44. If they can pull it off, the selling may intensify and the XRP/USDT pair could plunge to the strong support at $0.41.
The first sign of strength will be a break and close above the moving averages. That could open the doors for a potential rally to the $0.56 to $0.59 resistance zone, where the bears are expected to mount a strong defense.
Cardano price analysis
The narrow range trading in Cardano (ADA) resolved to the downside on July 5. This suggests that the short-term bulls have given up and are booking profits.
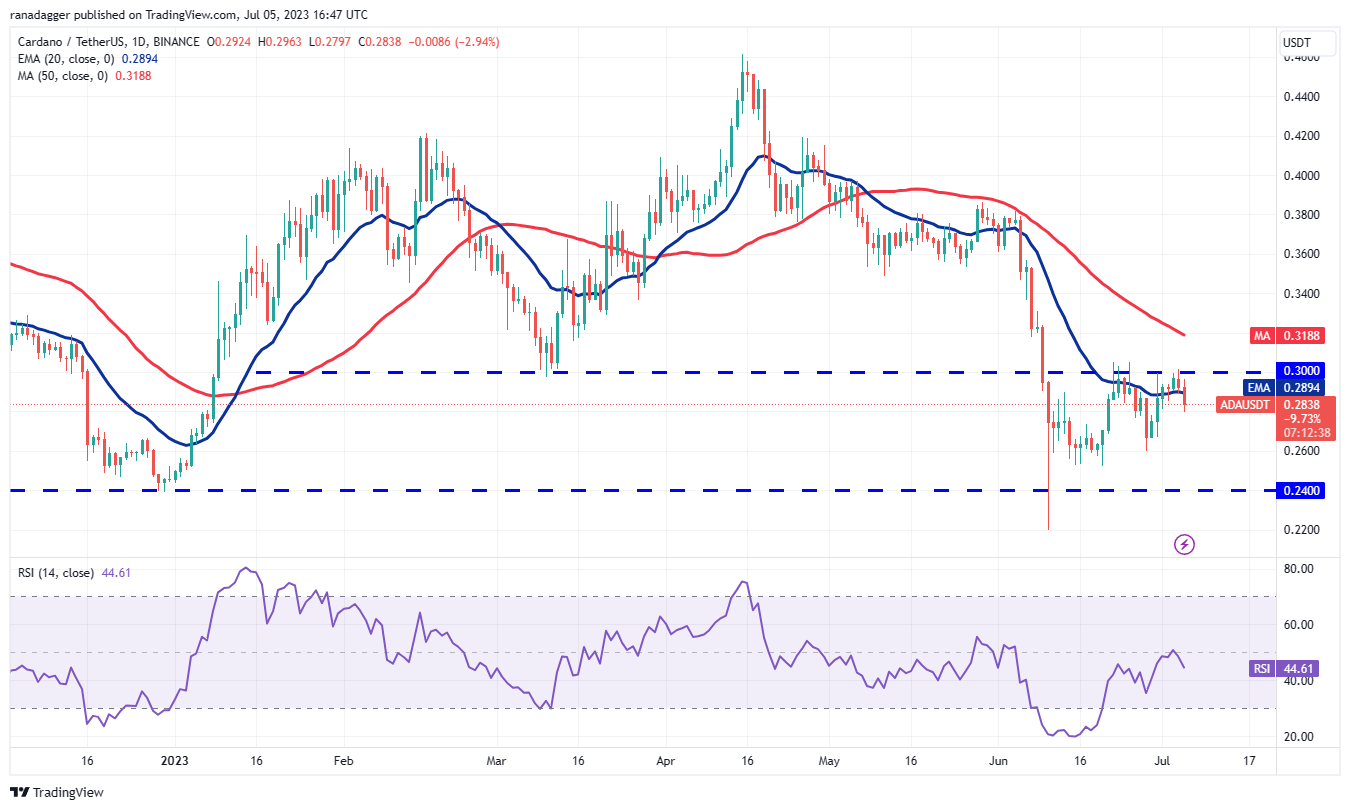
If the price sustains below the 20-day EMA ($0.29), the bears will try to sink the ADA/USDT pair to $0.26. Such a move will suggest that the pair may remain stuck inside the $0.30 to $0.24 range for a few more days.
Conversely, if the price turns up from the current level and breaks above $0.30, it will suggest the start of a sustained recovery. There might be a minor pit stop at the 50-day SMA ($0.32), but it is likely to be crossed. Above this level, the pair could surge toward $0.38.
Dogecoin price analysis
The bulls again tried to push and sustain Dogecoin (DOGE) above the overhead resistance of $0.07 on July 4, but the bears held their ground.
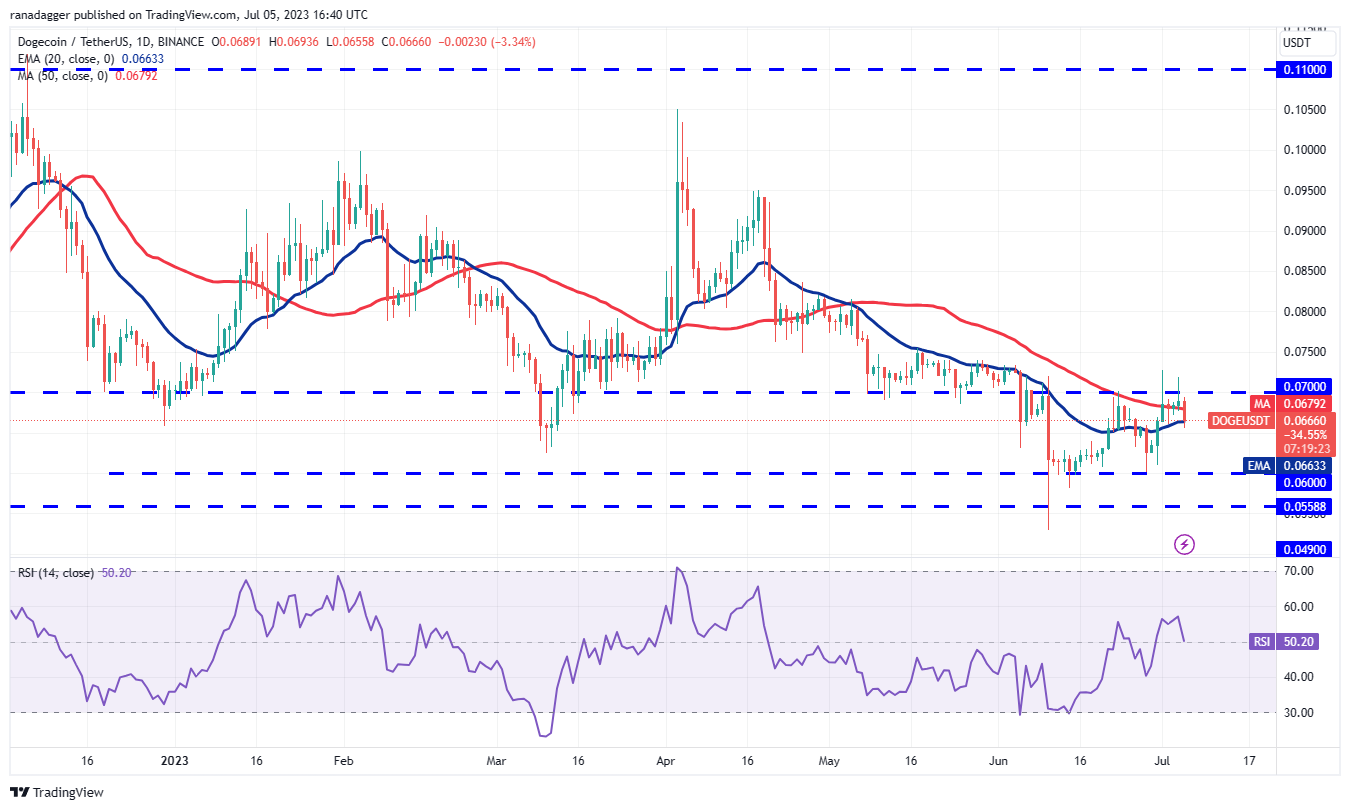
The 20-day EMA ($0.07) has started to turn up gradually, but the RSI has dipped to the midpoint, indicating that the positive momentum may be weakening. If the price breaks and sustains below the 20-day EMA, it will suggest that the DOGE/USDT pair may spend some more time inside the range between $0.06 and $0.07.
If bulls want to gain the upper hand, they will have to propel and sustain the price above $0.07. That could start a recovery in the pair that could reach $0.08 and then $0.10.
Solana price analysis
The long wick on Solana’s (SOL) July 4 candlestick shows that the bears are strongly protecting the level. A minor positive in favor of the bulls is that they have not allowed the price to dip back below the immediate support at $18.70.
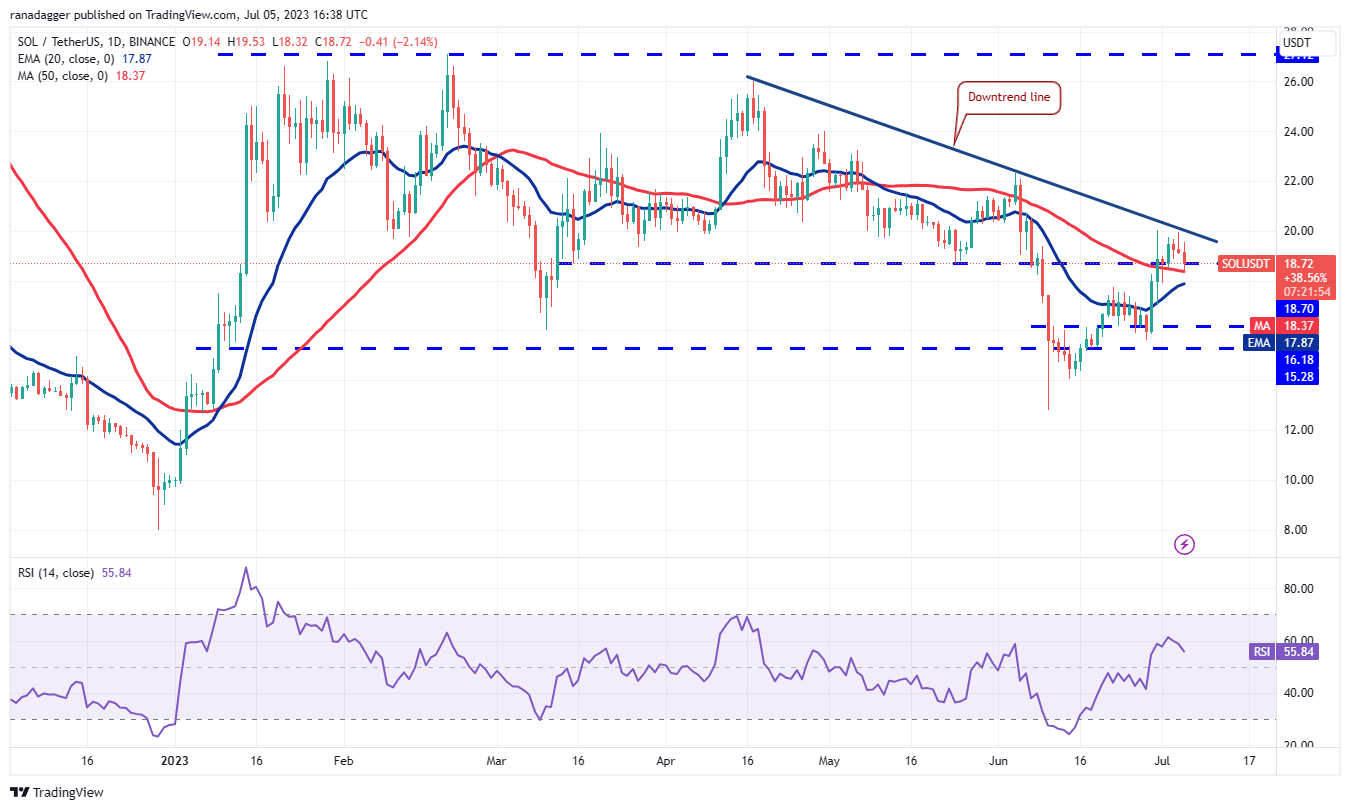
The 20-day EMA ($17.87) has started to turn up and the RSI is in positive territory, indicating that buyers have the upper hand. The bulls will again try to overcome the barrier at the downtrend line. If they succeed, the SOL/USDT pair may jump to $22 and then to $24.
Contrary to this assumption, if the price continues lower and breaks below the moving averages, it will suggest the start of a deeper correction. The pair may then slump to the strong support zone between $16.18 and $15.28.
Related: Can Bitcoin repeat a 2017-like rally as dollar correlation reverses?
Litecoin price analysis
Litecoin (LTC) turned down sharply from the overhead resistance of $115 and slipped below the breakout level of $106. This suggests the start of a corrective phase.
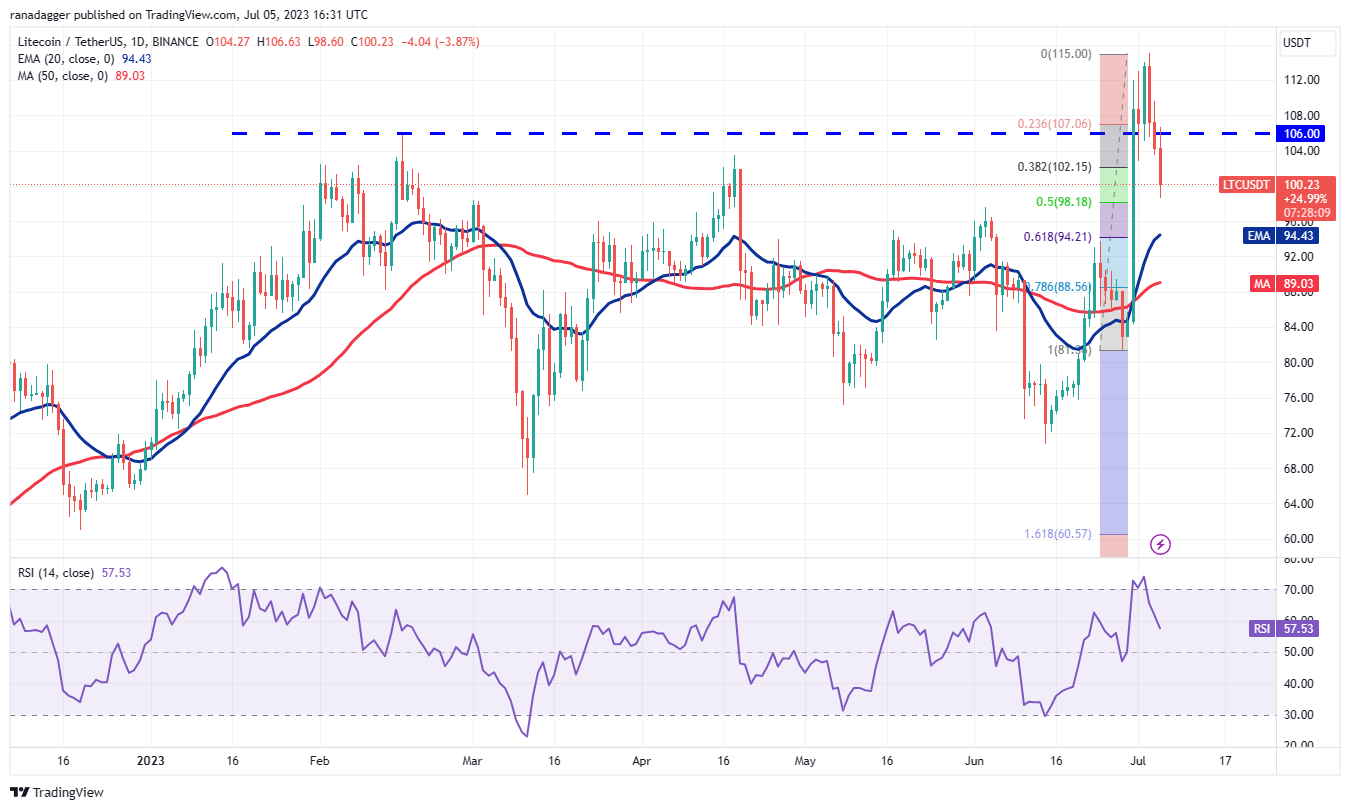
The 50% Fibonacci retracement level of $98 is an important support level to watch out for. A strong bounce off this level will be a positive sign, as it will show that traders are buying on dips. That will increase the likelihood of a retest of $115. If this resistance gives way, the LTC/USDT pair may resume its uptrend toward $136.
On the contrary, if the price breaks below $98, it will suggest that short-term traders may be booking profits. The pair may then dump to the 20-day EMA ($94). A deeper correction is likely to delay the resumption of the up move.
Polygon price analysis
Buyers pushed Polygon (MATIC) above the overhead resistance of $0.69 on July 3, which completed a bullish ascending triangle pattern.
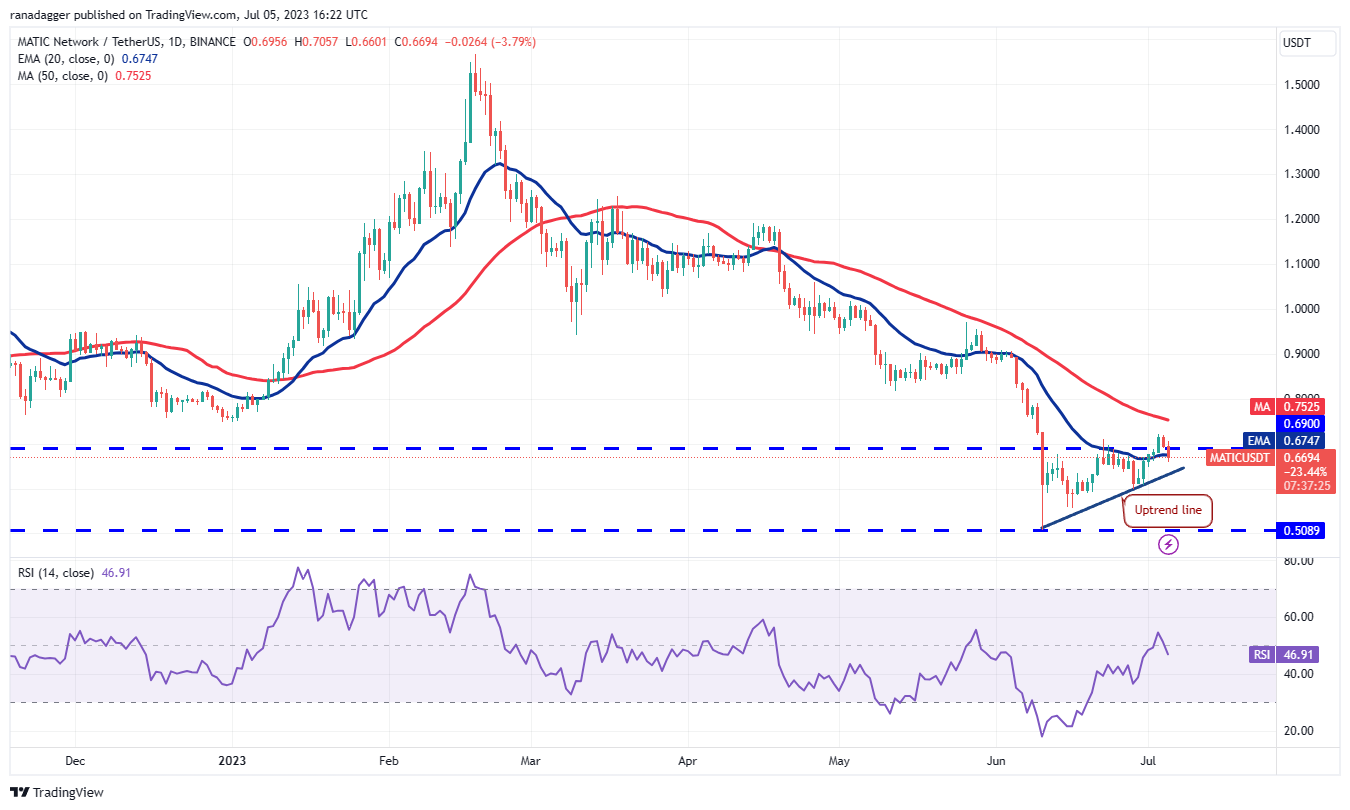
However, the bulls could not sustain the higher levels as the bears pulled the price back below the breakout level of $0.69.
Nếu giá bật ra khỏi mức hiện tại và tăng trên $0,72, nó sẽ gợi ý sự bắt đầu của một động thái tăng mới. Cặp MATIC/USDT sau đó có thể leo lên mục tiêu mô hình là 0.88 đô la. Đường SMA 50 ngày (0,75 đô la) có thể hoạt động như một rào cản, nhưng nó có khả năng bị
The important support to watch on the downside is the uptrend line. A break below it may sink the pair to $0.56.
Polkadot price analysis
Polkadot (DOT) turned down from the overhead resistance of $5.56 on July 3, indicating that the bears are fiercely defending the level.

The DOT/USDT pair has slipped to the immediate support at $5.15, which is an important level to keep an eye on. The moving averages are placed just below this support; hence, the bulls will try to start a recovery.
If the price rebounds sharply off $5.15, the pair may form an inverse head-and-shoulders pattern, which will complete on a break and close above $5.56. That could start a strong up move to the downtrend line and later to the pattern target of $6.90.
This positive view will invalidate in the near term if the price plummets below the moving averages. That could pull the pair to $4.74.
This article does not contain investment advice or recommendations. Every investment and trading move involves risk, and readers should conduct their own research when making a decision.
This article is for general information purposes and is not intended to be and should not be taken as legal or investment advice. The views, thoughts, and opinions expressed here are the author’s alone and do not necessarily reflect or represent the views and opinions of Cointelegraph.


