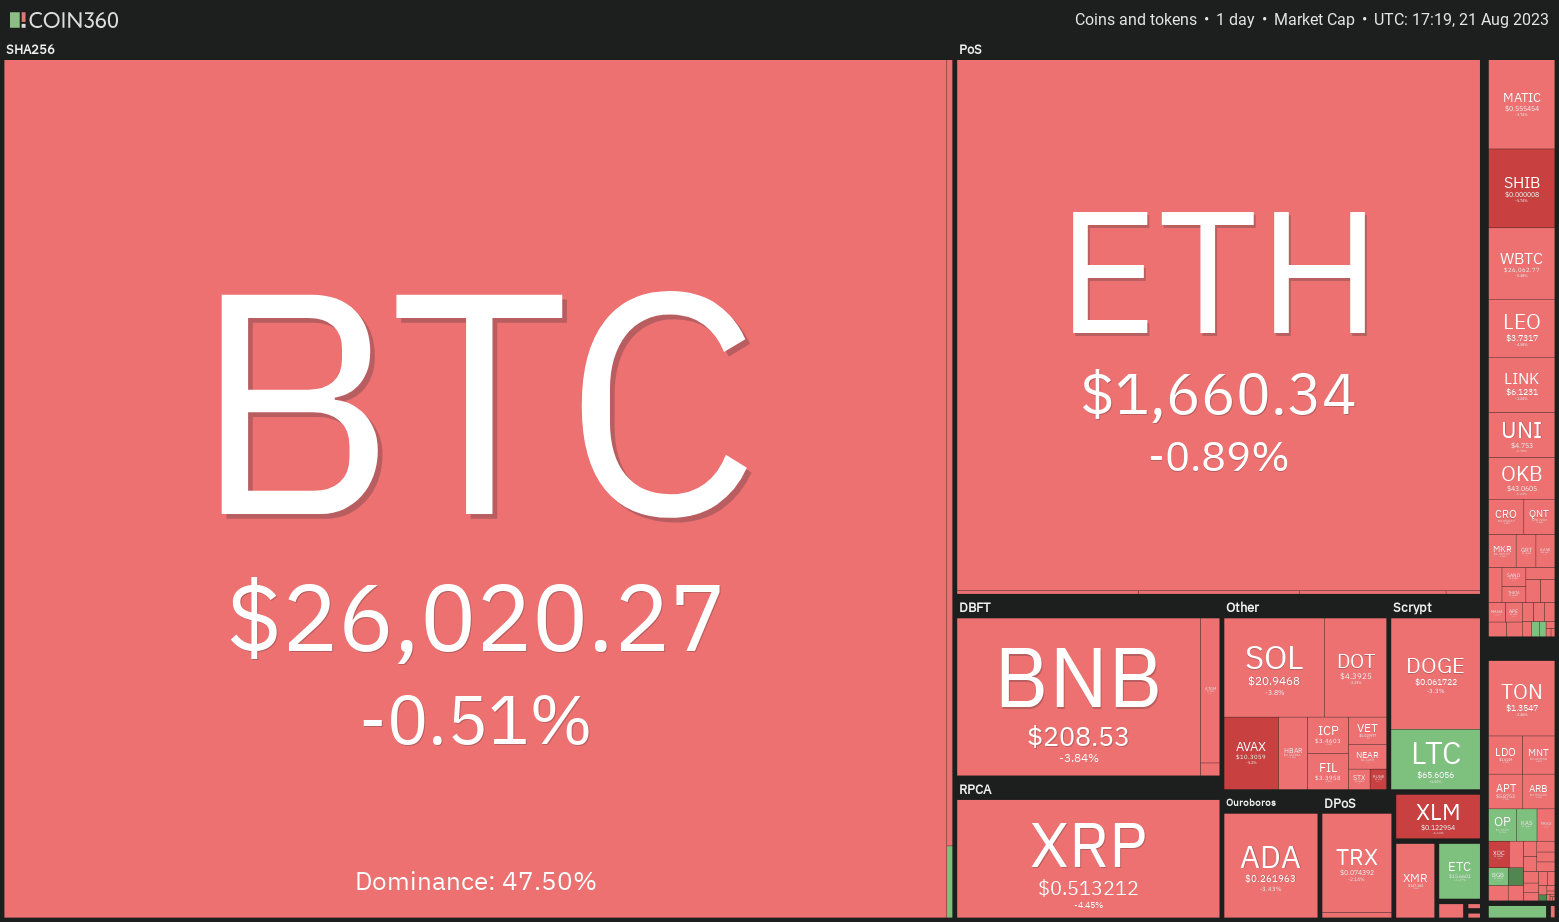
Sau khi giảm mạnh vào ngày 17 tháng 8, Bitcoin vẫn bị mắc kẹt trong một phạm vi hẹp vào cuối tuần. Điều này cho thấy sự thiếu quyết đoán giữa phe bò và phe gấu về động thái định hướng tiếp theo
Sau đợt giảm gần đây nhất, khoảng 88% Bitcoin (BTC) được nắm giữ bởi những người nắm giữ ngắn hạn (STH), những người sở hữu Bitcoin trong 155 ngày hoặc ít hơn, đã rơi vào tình trạng thua lỗ, theo bản tin hàng tuần của Glassnode, “The Week On-Chain”. Glassnode cảnh báo rằng nhóm thuần tập STH “ngày càng nhạy cảm về giá
Trong khi đó, những người nắm giữ lâu dài đã không hoảng loạn cũng như không đi mua sắm trong mùa thu hiện tại.
Các nhà giao dịch có khả năng theo dõi chặt chẽ bài phát biểu của Chủ tịch Cục Dự trữ Liên bang Jerome Powell tại Hội nghị chuyên đề kinh tế Jackson Hole hàng năm vào ngày 25 tháng 8. Nếu Powell không tạo ra một bất ngờ tiêu cực, thì sự kiện này có thể trở nên lạc quan đối với các tài sản rủi ro. Lịch sử cho thấy chứng khoán Mỹ thường tăng trong tuần sau Jackson Hole.
What are the important support and resistance levels to watch for in Bitcoin and altcoins? Let’s analyze the charts to find out.
Phân tích giá chỉ số S&P 500
The S&P 500 Index (SPX) is correcting in an uptrend. Typically pullbacks are a buying opportunity in an uptrend, but it is prudent to wait for the correction to end before resuming the purchases.
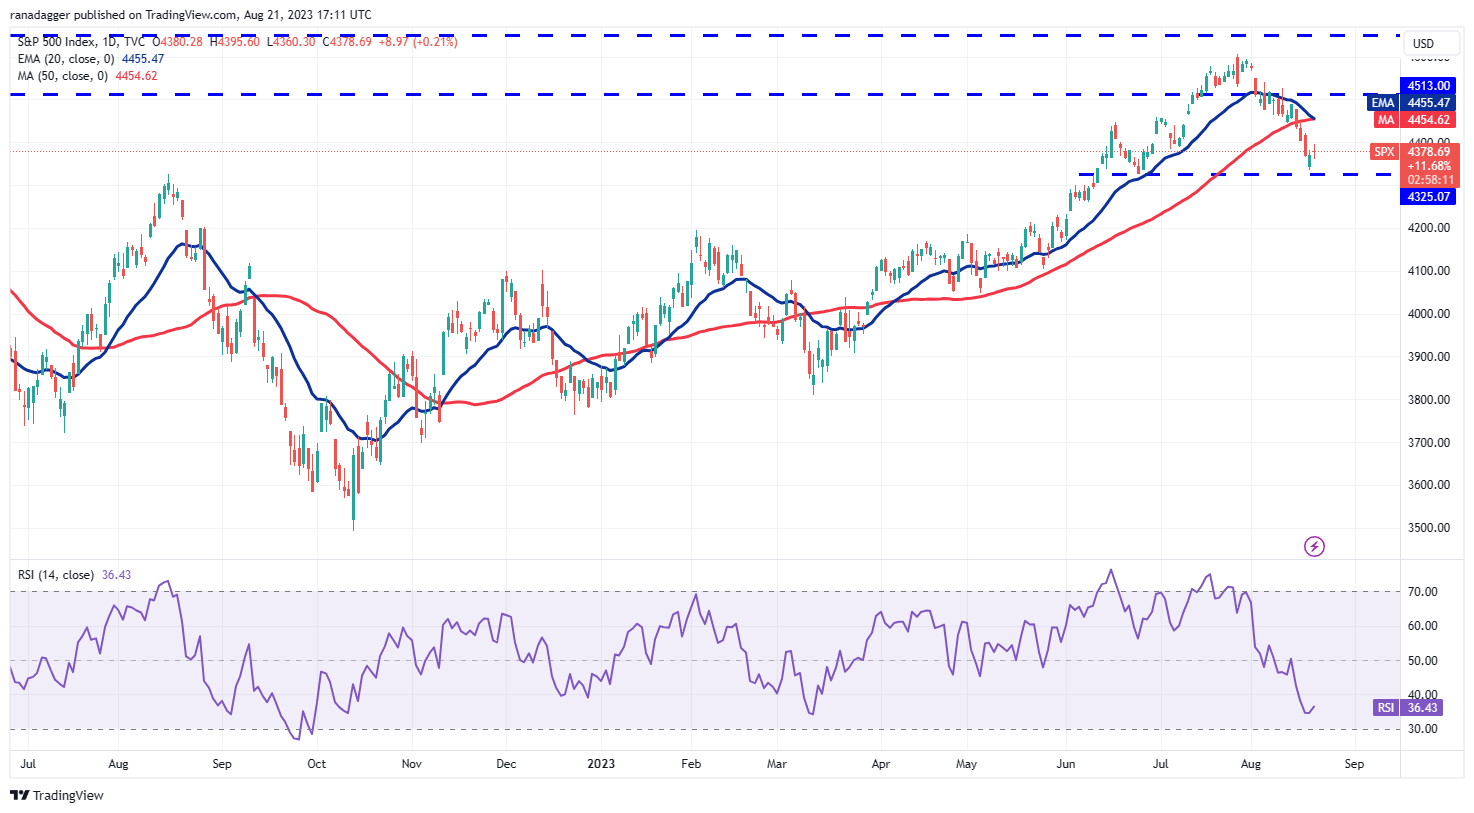
Giá đã đạt đến mức đột phá 4,307, đây là mức quan trọng cần theo dõi. Các đường trung bình động đang trên bờ vực của sự giao nhau giảm giá và chỉ số sức mạnh tương đối (RSI) nằm trong vùng tiêu cực, cho thấy những con gấu đang cố gắng
Việc bật lên khỏi mức hiện tại một lần nữa có khả năng phải đối mặt với việc bán tại các đường trung bình động. Nếu giá giảm từ đường trung bình động, chỉ số sẽ có nguy cơ hình thành mô hình đầu vai giảm giá
Ngược lại, một đợt tăng trên đường trung bình động sẽ chỉ ra rằng giai đoạn điều chỉnh có thể đã kết thúc.
Phân tích giá Chỉ số Đô la Mỹ
Chỉ số Đô la Mỹ (DXY) đã phục hồi về đường xu hướng giảm, nơi phe gấu đang đặt ra một thách thức mạnh mẽ. Tuy nhiên, chỉ số này vẫn chưa mất điểm, cho thấy phe bò đã duy trì áp lực mua.
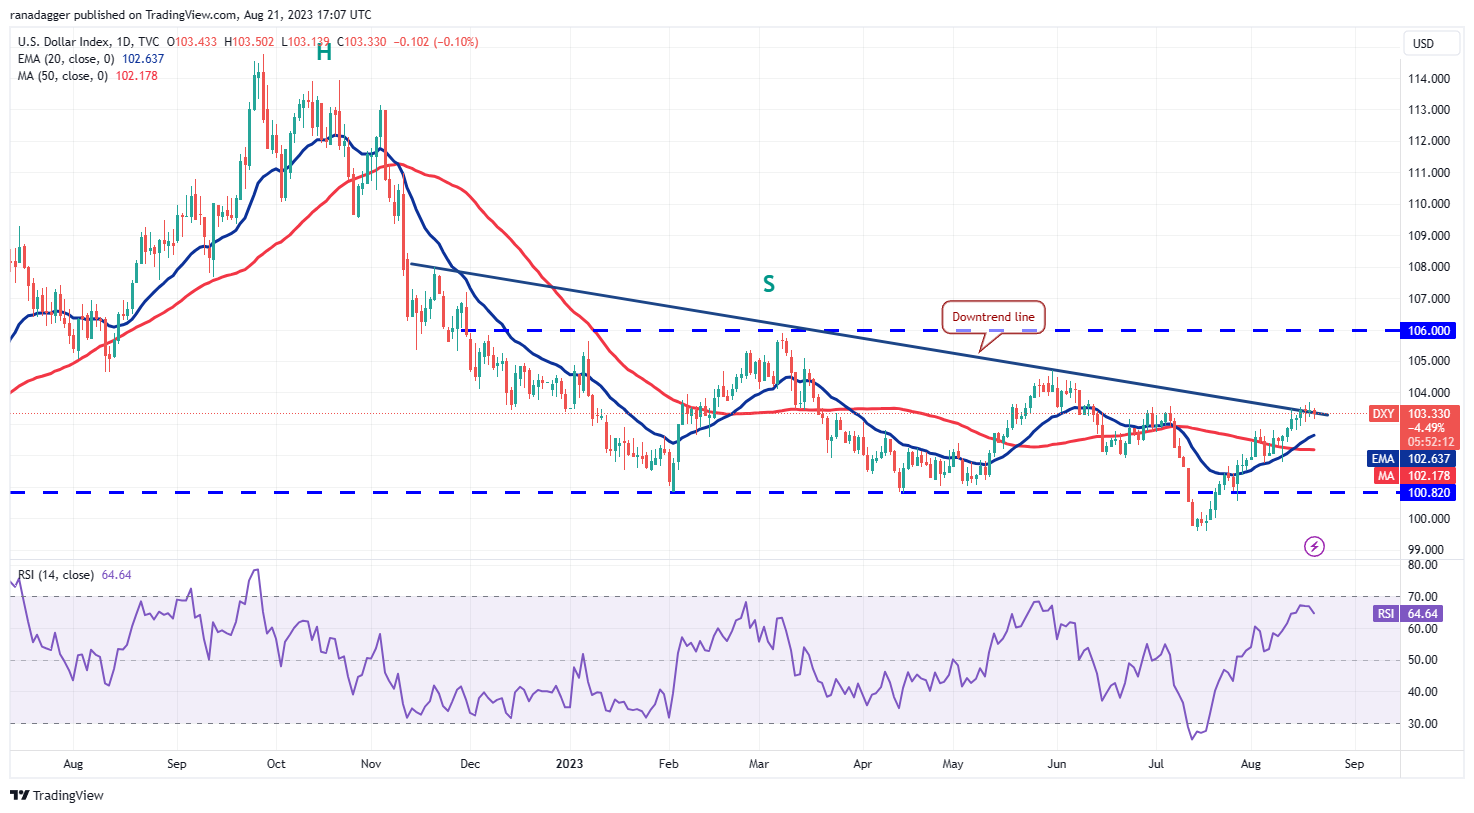
Nếu người mua đẩy chỉ số lên trên đường xu hướng giảm, điều đó sẽ cho thấy phe gấu đang mất dần sự kìm kẹp của họ. Sau đó, chỉ số này có thể tiếp tục phục hồi và đạt đến ngưỡng kháng cự trên cao tại 106. Mức này một lần nữa có khả năng thu hút sự bán mạnh mẽ của phe gấu.
Các đường trung bình động là hỗ trợ quan trọng cần chú ý khi đi xuống. Phe gấu sẽ phải giảm giá xuống dưới đường trung bình động đơn giản 50 ngày (SMA) ở mức 102 để báo hiệu sự trở lại. Điều đó có thể mở ra cánh cửa để kiểm tra lại mức hỗ trợ mạnh gần 101
Phân tích giá Bitcoin
Bitcoin has been consolidating inside a large range between $24,800 and $31,000 for the past several weeks. Inside a range, traders buy the dips to the support and sell near the overhead resistance. In between, trading may be random and volatile.
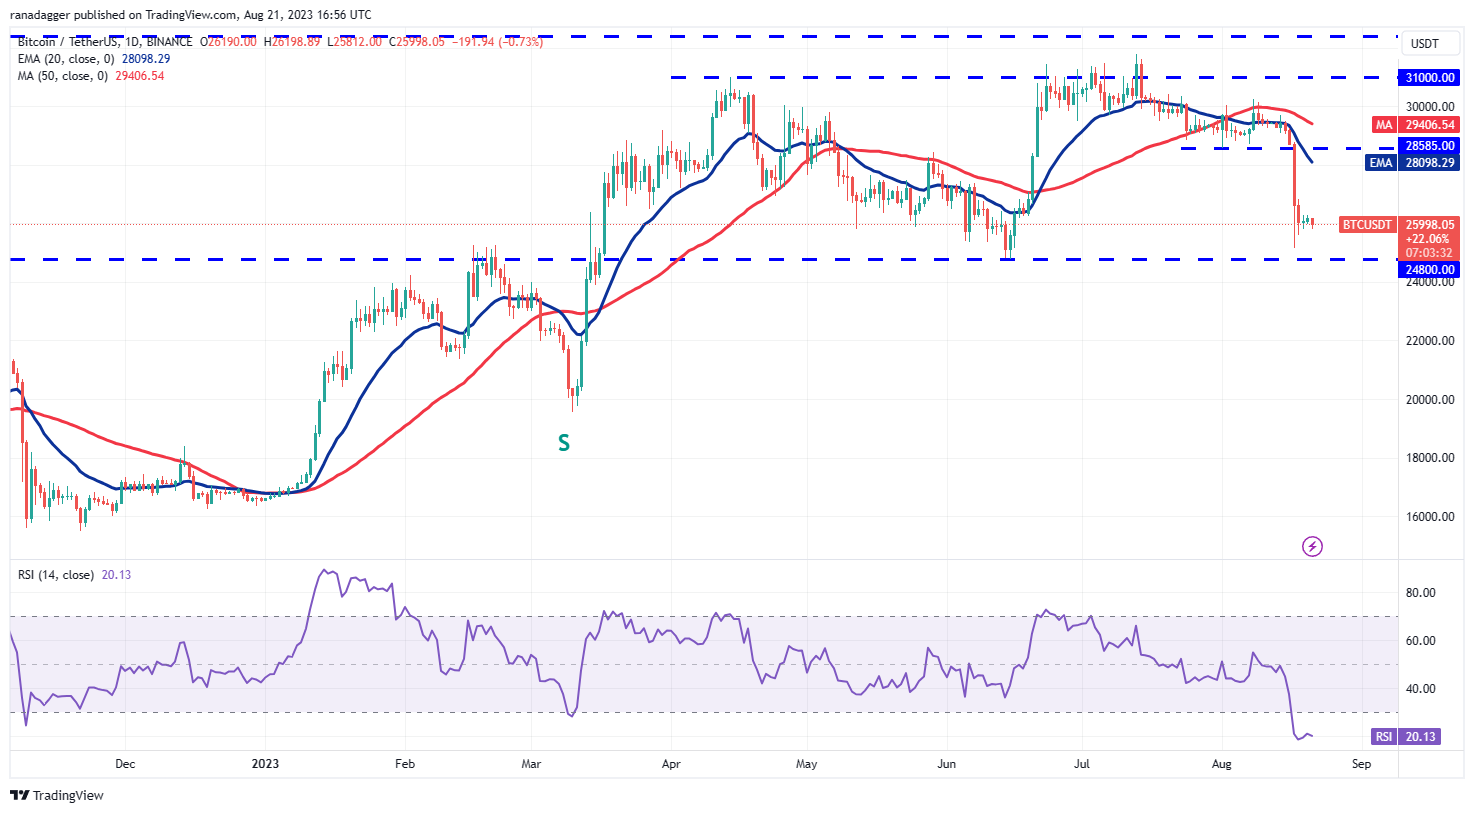
Các đường trung bình động đã giảm và chỉ báo RSI nằm trong vùng quá bán, cho thấy những con gấu đang kiểm soát vững chắc. Người bán sẽ cố gắng xây dựng lợi thế của họ bằng cách kéo giá xuống dưới 24.800 đô la, nhưng phe bò không có khả năng từ bỏ dễ
The buyers will try to start a recovery from the support, which is likely to pick up momentum above $26,833. The BTC/USDT pair may then rise to the 20-day exponential moving average (EMA) at $28,098, signaling that the range-bound action remains intact.
Ether price analysis
Ether’s (ETH) bounce is struggling to rise above $1,700, indicating that the bears have not given up and are selling on minor rallies.
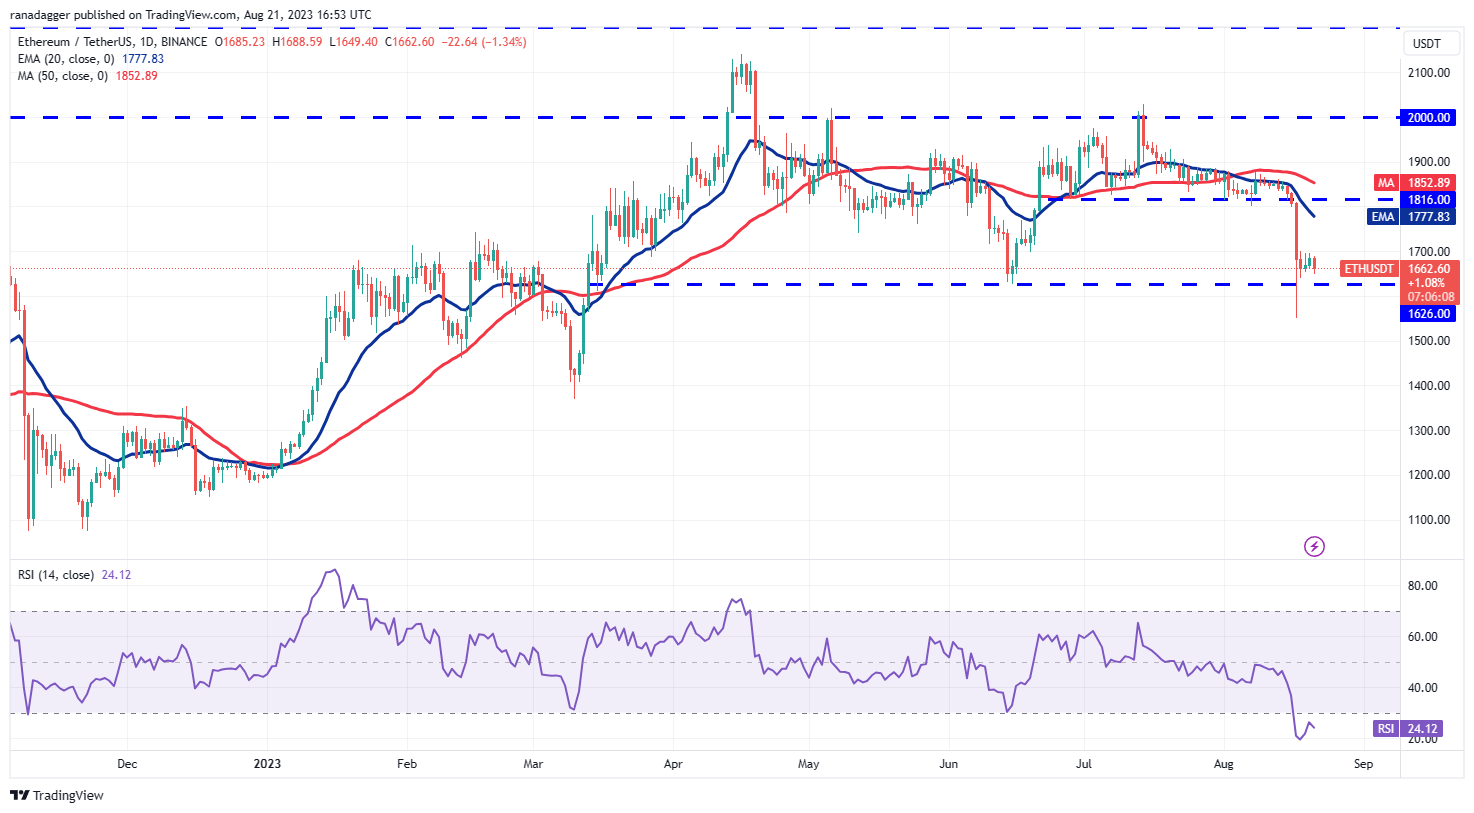
A shallow bounce usually indicates a lack of urgency among the bulls to buy. That increases the risk of a breakdown below the support. If the price turns down and slips below $1,626, it will suggest that bears remain in command. The ETH/USDT pair may then retest the intraday low of $1,550 made on Aug. 17.
Contrarily, if the price turns up from the current level and rises above $1,700, it will suggest the start of a stronger recovery. The first stop may be the 20-day EMA ($1,777), but if this level is crossed, the pair may reach the 50-day SMA ($1,852).
BNB price analysis
BNB (BNB) tumbled below the vital support at $220 on Aug. 17, and the bears have managed to defend the level since then. This suggests that the bears are trying to flip the $220 level into resistance.
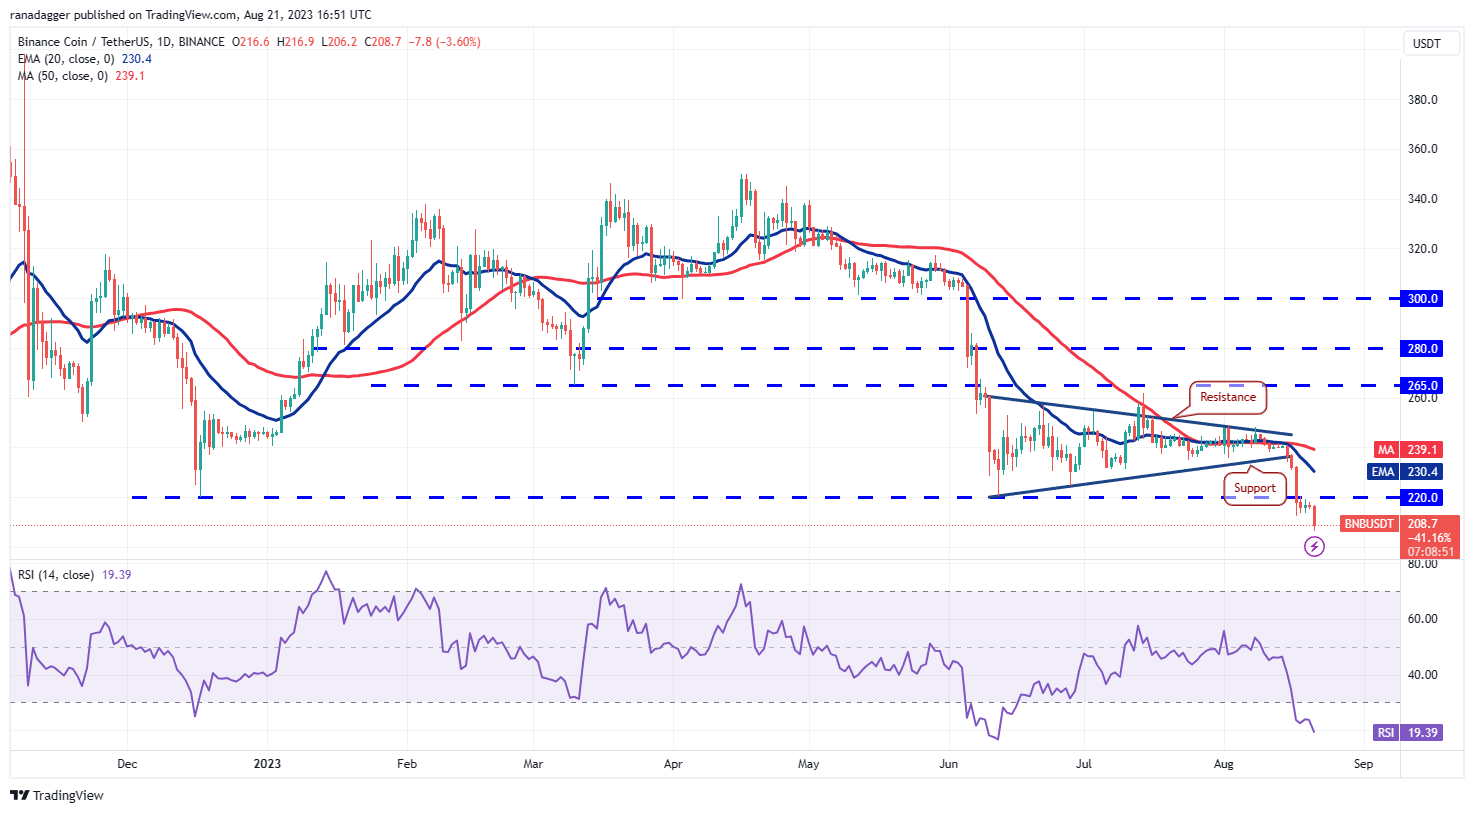
The price crashed below the immediate support at $212 on Aug. 21, indicating the resumption of the downtrend. The BNB/USDT pair could first plummet to the pattern target of $196 and eventually to the next major support at $183.
Time is running out for the bulls. If they want to salvage the situation, they will have to quickly drive and sustain the price above $220. The pair could then rise to the 20-day EMA ($230), which may again act as a stiff barrier.
XRP price analysis
XRP (XRP) bounced off the strong support at $0.41 on Aug. 17 and reached the overhead resistance at $0.56 on Aug. 20.
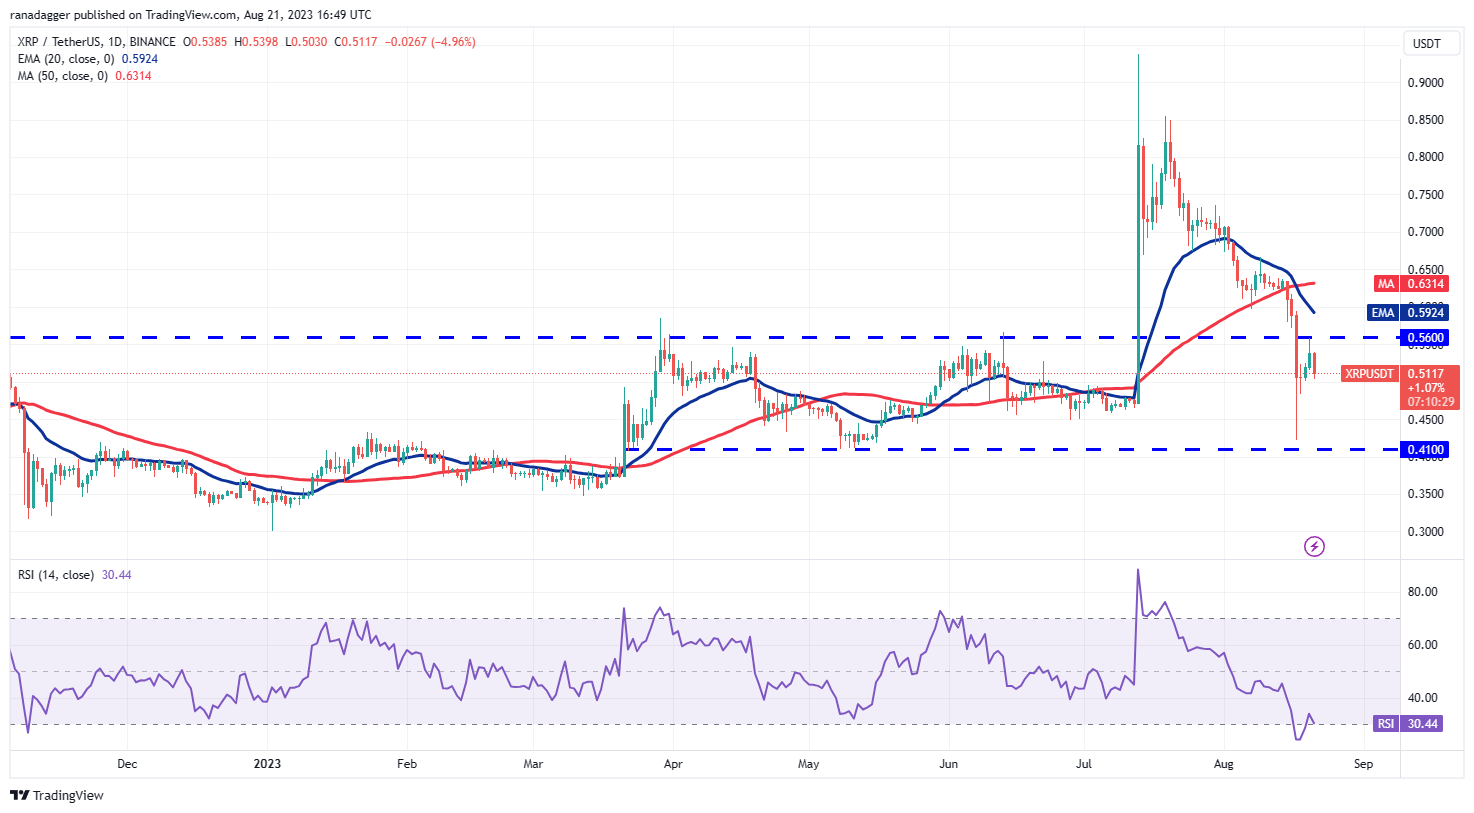
The bears are trying to stall the relief rally near $0.56, indicating that the sentiment remains negative and traders are selling on every minor rise. If the price turns down and skids below $0.48, it will suggest that the XRP/USDT pair may swing between $0.41 and $0.56 for a few days.
The downsloping 20-day EMA ($0.59) and the RSI near the oversold zone signal that bears have the edge. The first sign of strength will be a break and close above the 20-day EMA. That will indicate that the bearish pressure may be reducing.
Cardano price analysis
Cardano (ADA) snapped back from the crucial support at $0.24 on Aug. 17, but the relief rally is facing downward pressure at the overhead resistance near $0.28.
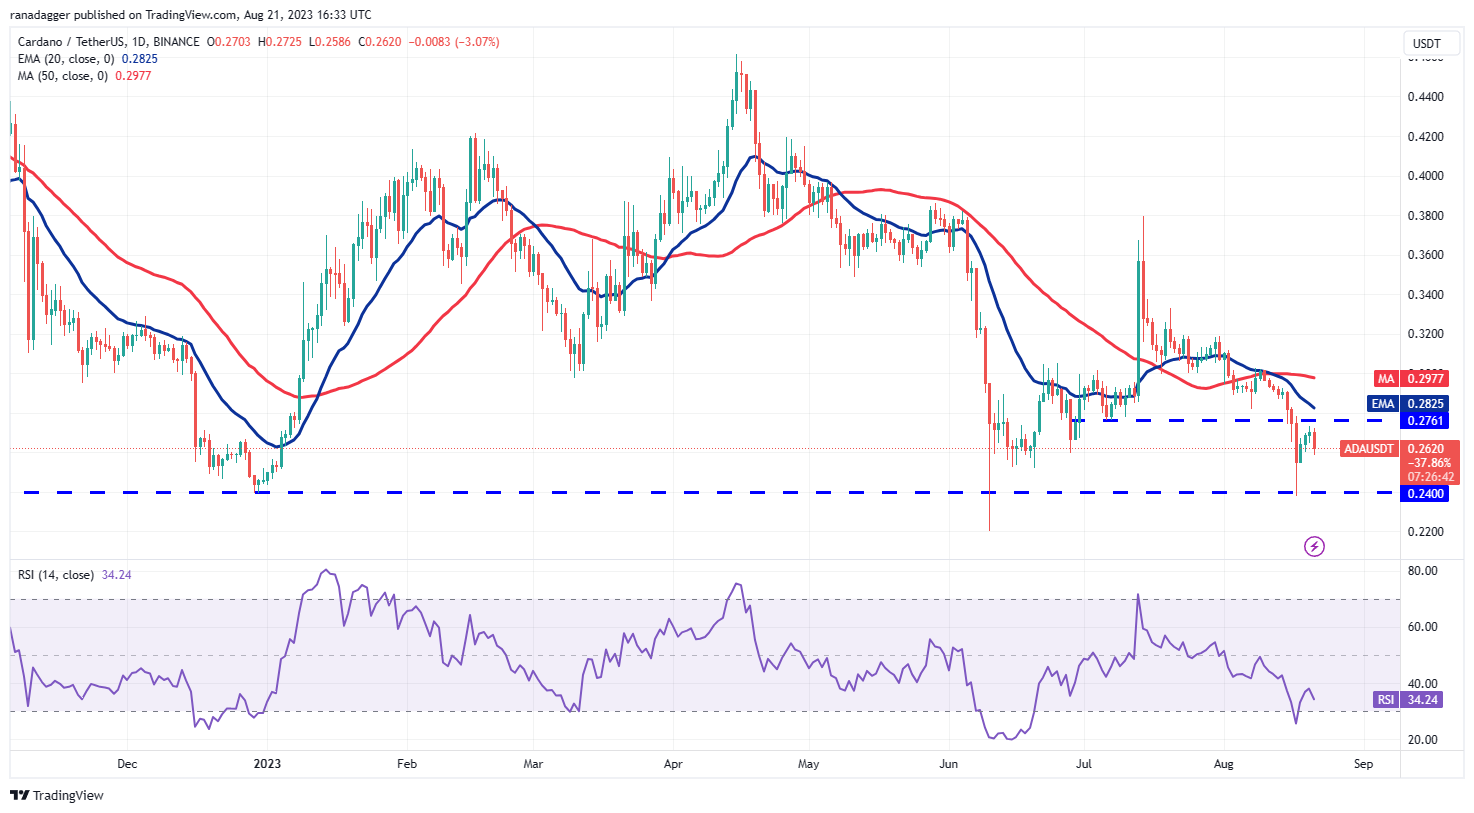
The downsloping 20-day EMA ($0.28) and the RSI in the negative area suggest that bears have the upper hand. If the price slips below $0.26, it will indicate that the ADA/USDT pair may oscillate inside the tight range between $0.24 and $0.28 for a while longer.
Generally, a tight consolidation near a strong support level is a negative sign, and it may result in a breakdown. If the $0.24 support gives way, the pair may plunge to $0.22 and then to $0.20. If buyers want to prevent the decline, they will have to quickly thrust the price above the moving averages.
Related: Binance limits withdrawals in Europe, cites payment processor issues
Dogecoin price analysis
The bulls have managed to keep Dogecoin (DOGE) above the essential support at $0.06 for the past few days, but they have failed to start a strong bounce.
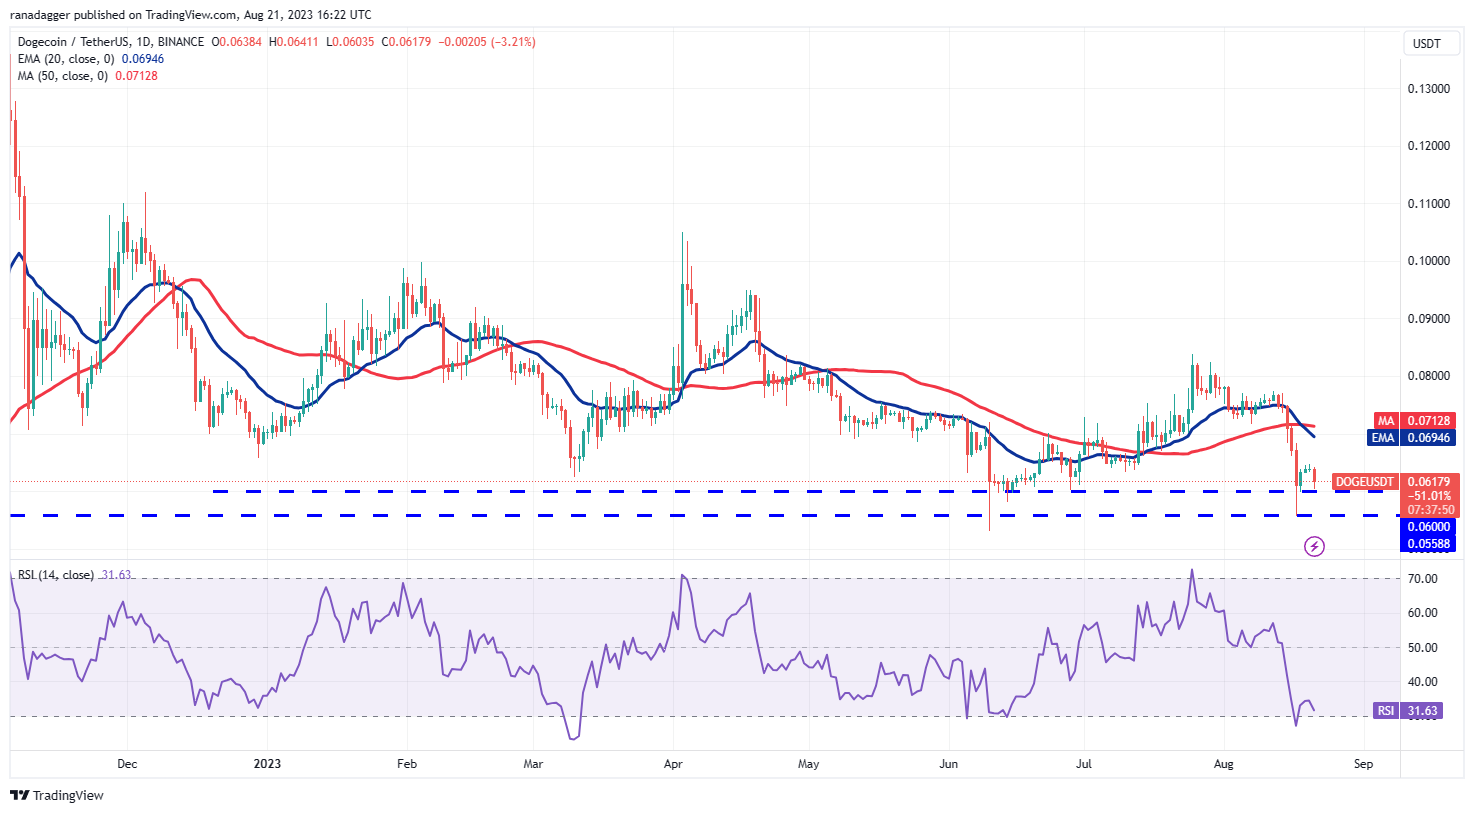
The shallow bounce suggests a negative sentiment where the bulls are not buying aggressively. This may have encouraged the bears to seize control, and they have pulled the price to the strong support at $0.06.
If the price breaks below $0.06, the DOGE/USDT pair could nosedive toward the next solid support near $0.05. Alternatively, if the price turns up from the current level, it will indicate that lower levels are attracting buyers. The pair may then climb to the moving averages. A break above the 50-day SMA ($0.07) could start a sustained recovery.
Solana price analysis
Solana (SOL) bulls are facing stiff resistance from the bears near the overhead resistance at $22.30. This suggests that the bears are trying to flip the $22.30 level into resistance.
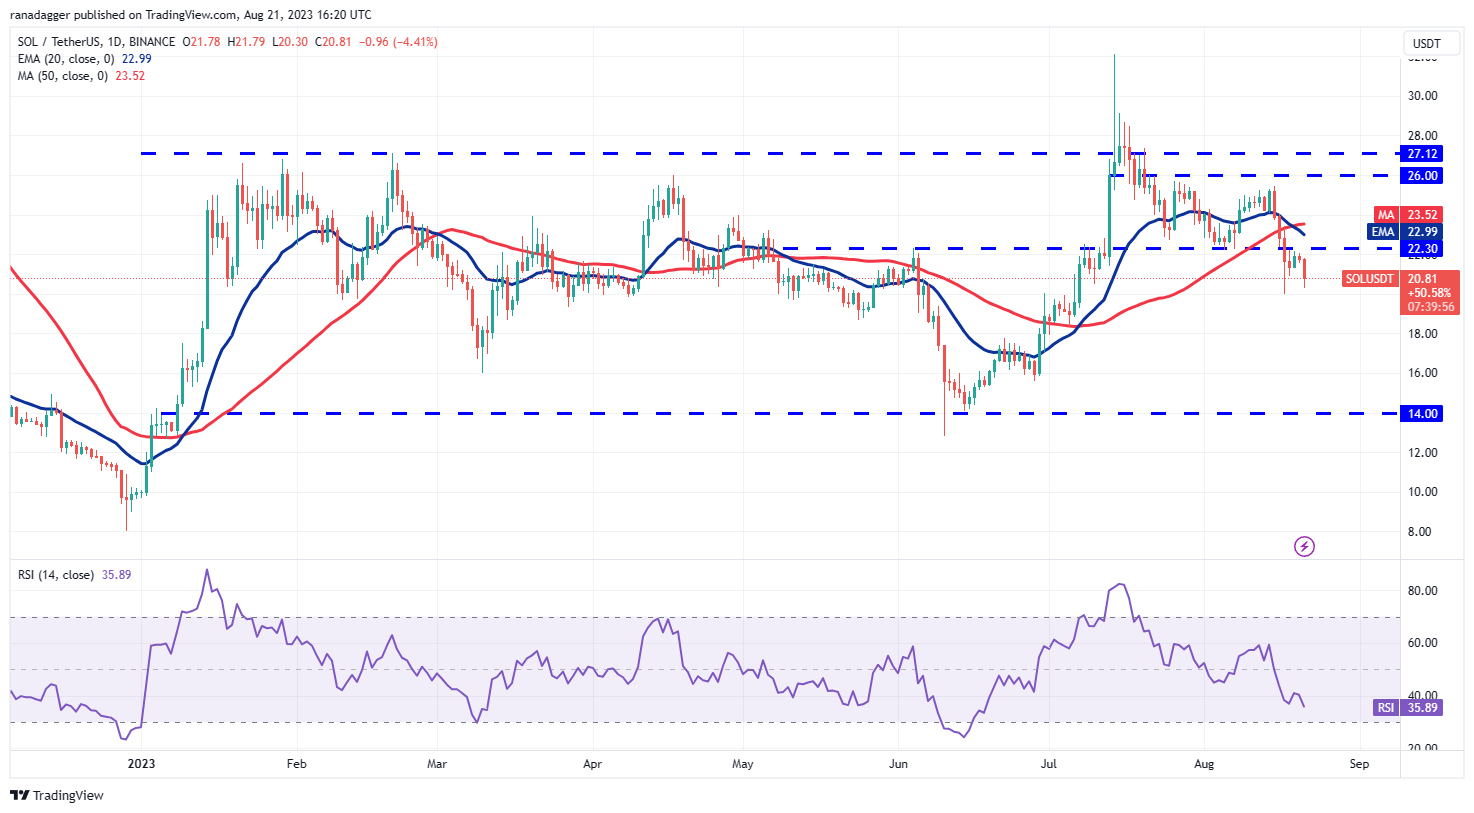
The moving averages have completed a bearish crossover and the RSI is in the negative zone, indicating that bears have the edge. The SOL/USDT pair could retest the support at $20. If this level gives way, the pair may start a deeper correction to $18 and subsequently to $15.60.
If the bulls want to make a comeback, they will have to kick the price above the moving averages. It is going to be a tough ask, but if they manage to do it, the pair may rally to the overhead resistance zone between $26 and $27.12.
Polkadot price analysis
Polkadot (DOT) formed a Doji candlestick pattern on Aug. 19 and 20, indicating that the buying pressure has been reducing.
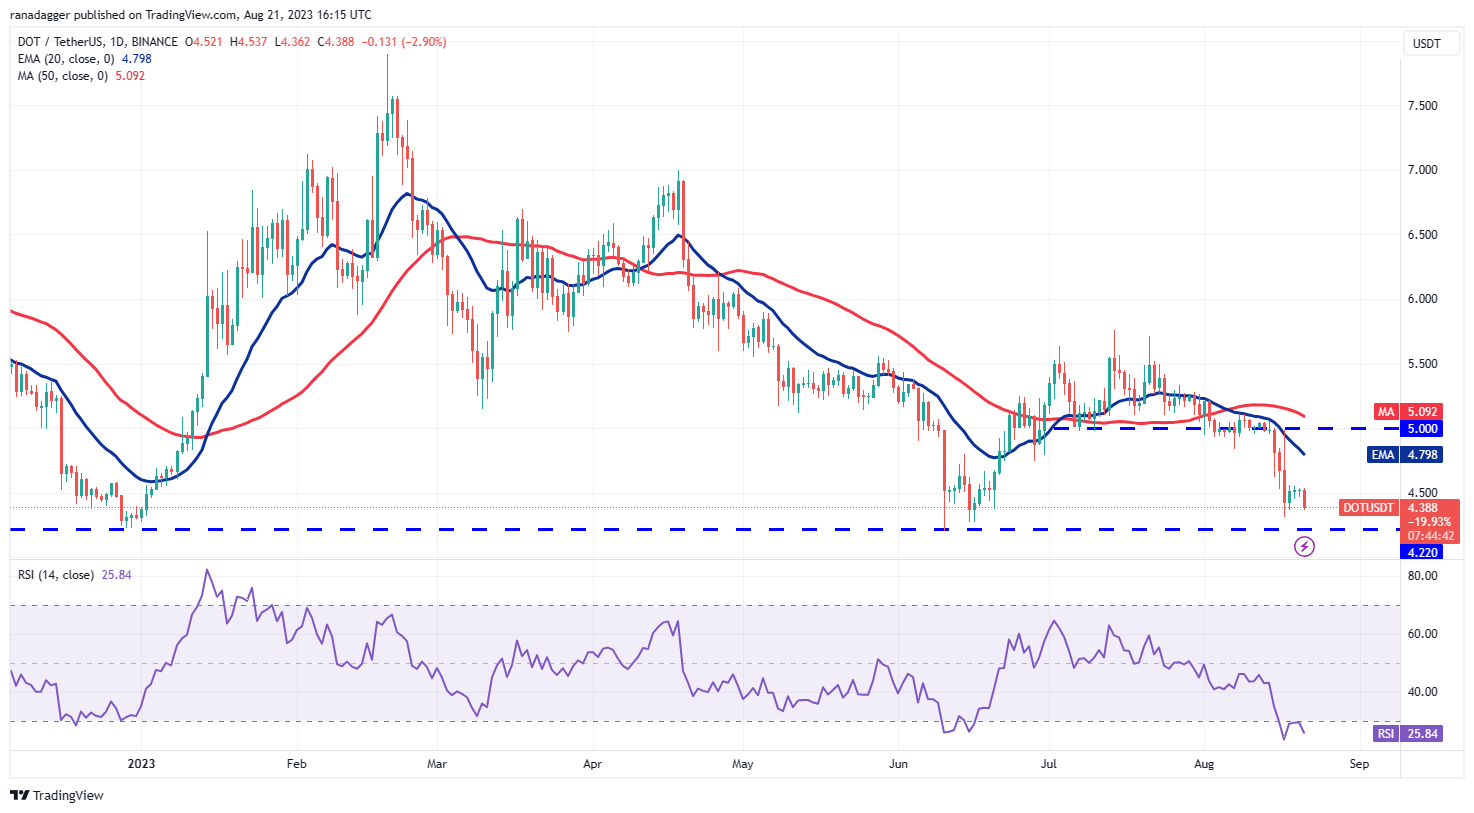
If the price continues lower and breaks below $4.36, it will suggest that bears are trying to gain the upper hand. The DOT/USDT pair could then retest the pivotal support at $4.22. If this level caves in, the selling may accelerate and the pair could start the next leg of the downtrend.
Conversely, if the price turns up and breaks above $4.56, it will suggest that bulls are making a comeback. The pair could then rally to the 20-day EMA ($4.79), which is again likely to behave as a roadblock.


